


 |
| Gold V.1.3.1 signal Telegram Channel (English) |
GBPUSD-Daily
2025-07-17 @ 09:54
https://int.1uptick.com/wp-content/uploads/2025/07/FX-GBPUSD-Daily-2025-07-17T085359.9310700.png”
Market Overview
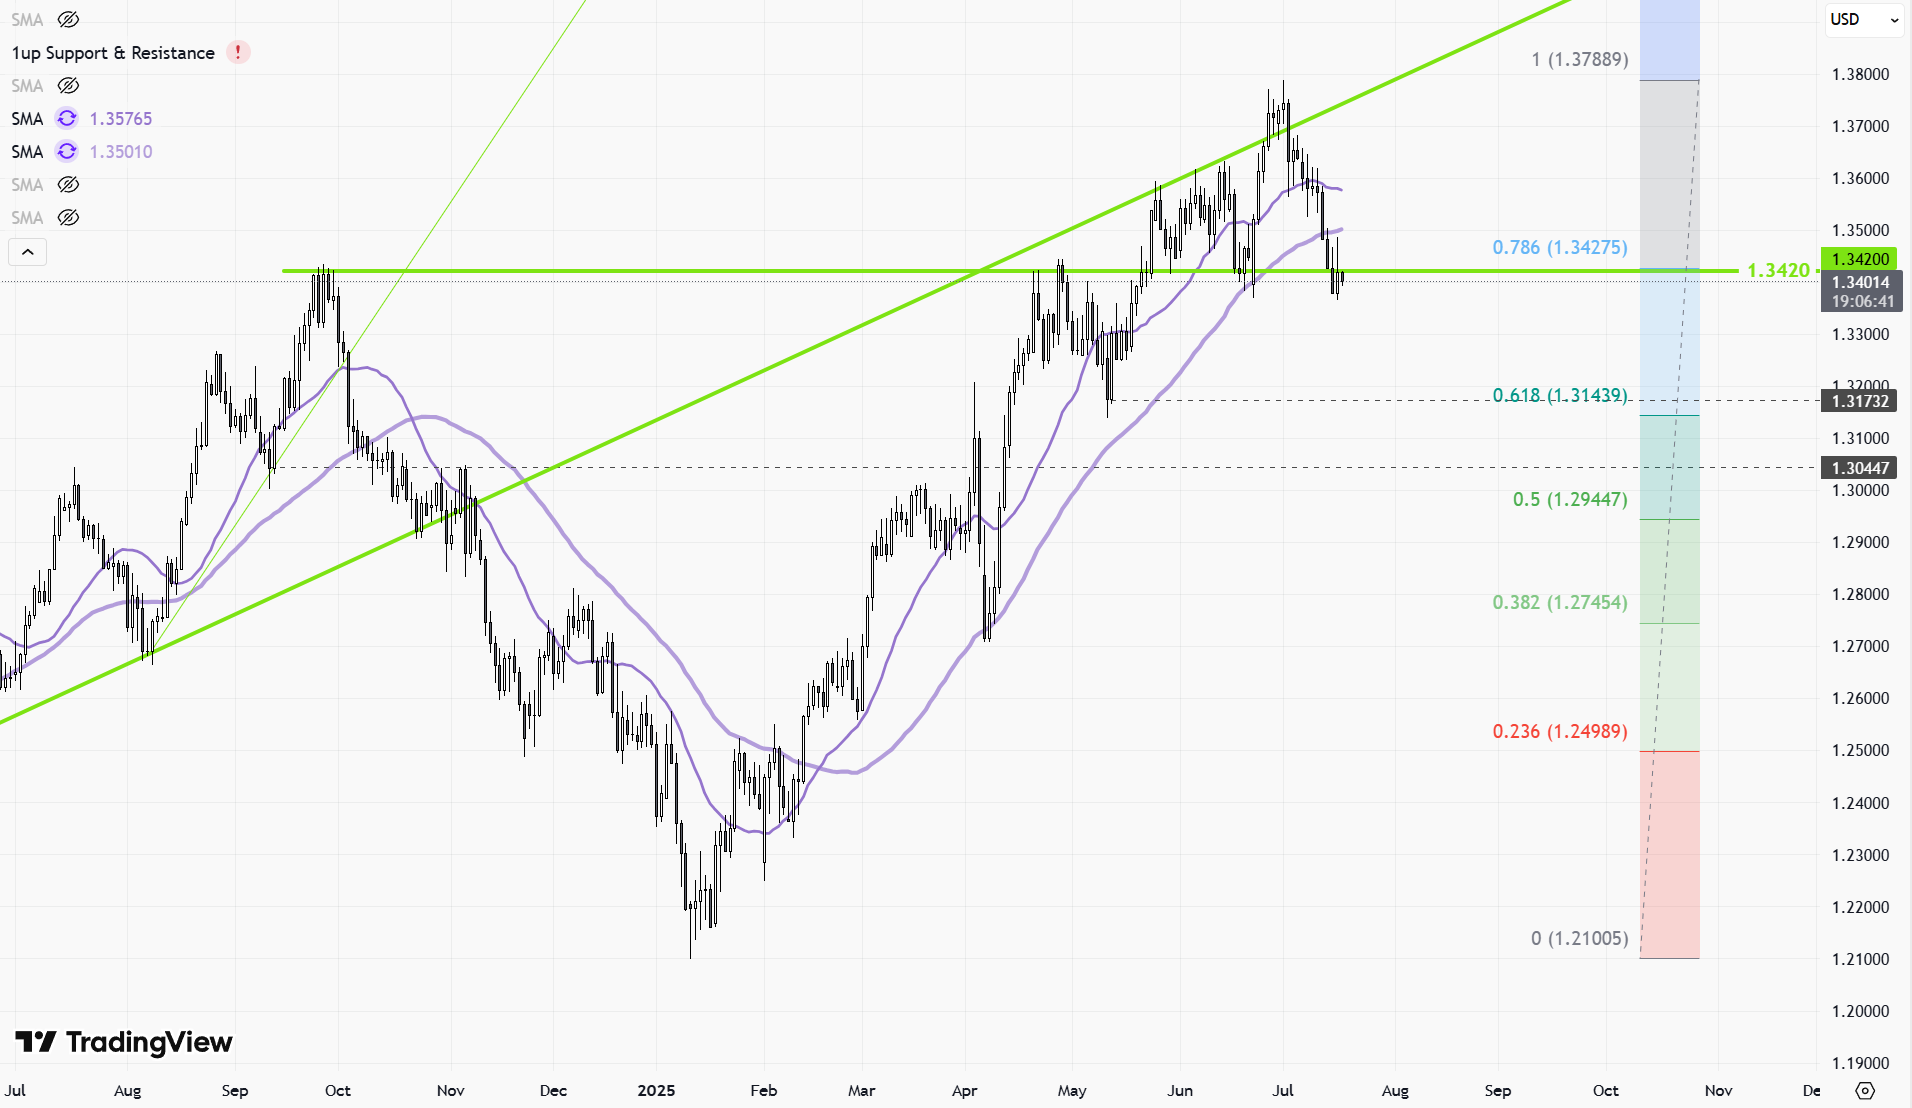
GBPUSD experienced sustained downward pressure over the past week, falling from highs around 1.3480 to lows near 1.3400 as the pair endured an eight-day losing streak. This recent decline comes after several months of gains fueled by earlier USD weakness. The main drivers behind the latest move are renewed US dollar strength ahead of impending US tariffs, which have restored the dollar’s safe-haven appeal. Additionally, the UK’s macroeconomic backdrop has weighed on sterling, with weaker GDP and industrial figures reinforcing expectations of a Bank of England rate cut as soon as August. Uncertainty around UK labor data and interest rate differentials between the US and UK have contributed to capital outflows from UK assets, limiting any potential sterling recovery. Technical indicators suggest key support lies around 1.3370, with a deeper drop possible if breached, while any relief would first require a move back above 1.34.
GBP/USD Daily Candlestick Chart Technical Analysis — July 17, 2025
Technical Indicators
- Moving Averages: The pair remains above the 50-day and 100-day Exponential Moving Averages, indicating residual bullish undertones in the medium term, but the recent price pullback is challenging that structure.
- RSI and Stochastics: Both the Relative Strength Index and Stochastic indicators are moving below the neutral 50 mark and are sloping downward, signaling loss of upside momentum and supporting a weak to neutral outlook in the short term.
- Momentum: The prevailing momentum is bearish, with the indicators suggesting that seller control persists, though short-term oversold readings could spark brief rebounds.
Chart Patterns and Price Structure
- Trend Direction: GBP/USD is currently experiencing a downward correction within a broader uptrend channel. The break below recent support is pressuring the pair to test lower boundaries, indicating a short-term downtrend or consolidation phase.
- Prominent Patterns: There are no clear, large-scale reversal patterns such as head and shoulders or double top/bottoms visible at the moment. The price action does suggest a channel/flag-like retracement, with the pair holding close to key lower trendline support.
- Candlestick Patterns: Recent sessions have produced small-bodied candles near support, suggesting indecision after the sharp drop. Look for a pronounced bullish engulfing or hammer formation to confirm sustainable rebound potential; these are not yet present.
Support and Resistance Levels
- Major Support:
- 1.3425: Recently tested, now acting as a pivotal level for rebound attempts.
- 1.3370: Critical structural support; a decisive break below this would confirm continued bearish momentum toward the next level.
- 1.3175: Next major downside target if the 1.3370 floor is lost.
- Major Resistance:
- 1.3465: Nearest overhead resistance from the current consolidation band.
- 1.3585 and 1.3680: Next significant resistance clusters on any rebound attempts.
Other Technical Insights
- Volume Trends: Not visible on the provided chart, but recent price action suggests declining momentum as the pair nears major support—typical for the end stage of short-term corrections.
- Pattern Implications: The lack of aggressive bullish candlesticks or reversal formations warns traders to remain cautious about anticipating a bottom. Instead, wait for a confirmed close above immediate resistance or a clear reversal pattern for directional conviction.
Actionable Technical Summary
GBP/USD remains under short-term pressure following a sustained pullback from its year-to-date high. Indicators point to weakening momentum and the potential for further downside, especially if the pair breaks conclusively below the 1.3370 support. While there are tentative signs of possible bottom-fishing around 1.3425, no strong reversal patterns have yet emerged. Traders should monitor for a bullish candlestick formation or a daily close above 1.3465 to signal a rebound. Absent these, risk remains skewed to the downside until technical structure decisively improves.