


 |
| Gold V.1.3.1 signal Telegram Channel (English) |
GBPUSD-Daily
2025-07-18 @ 12:14
Market Overview
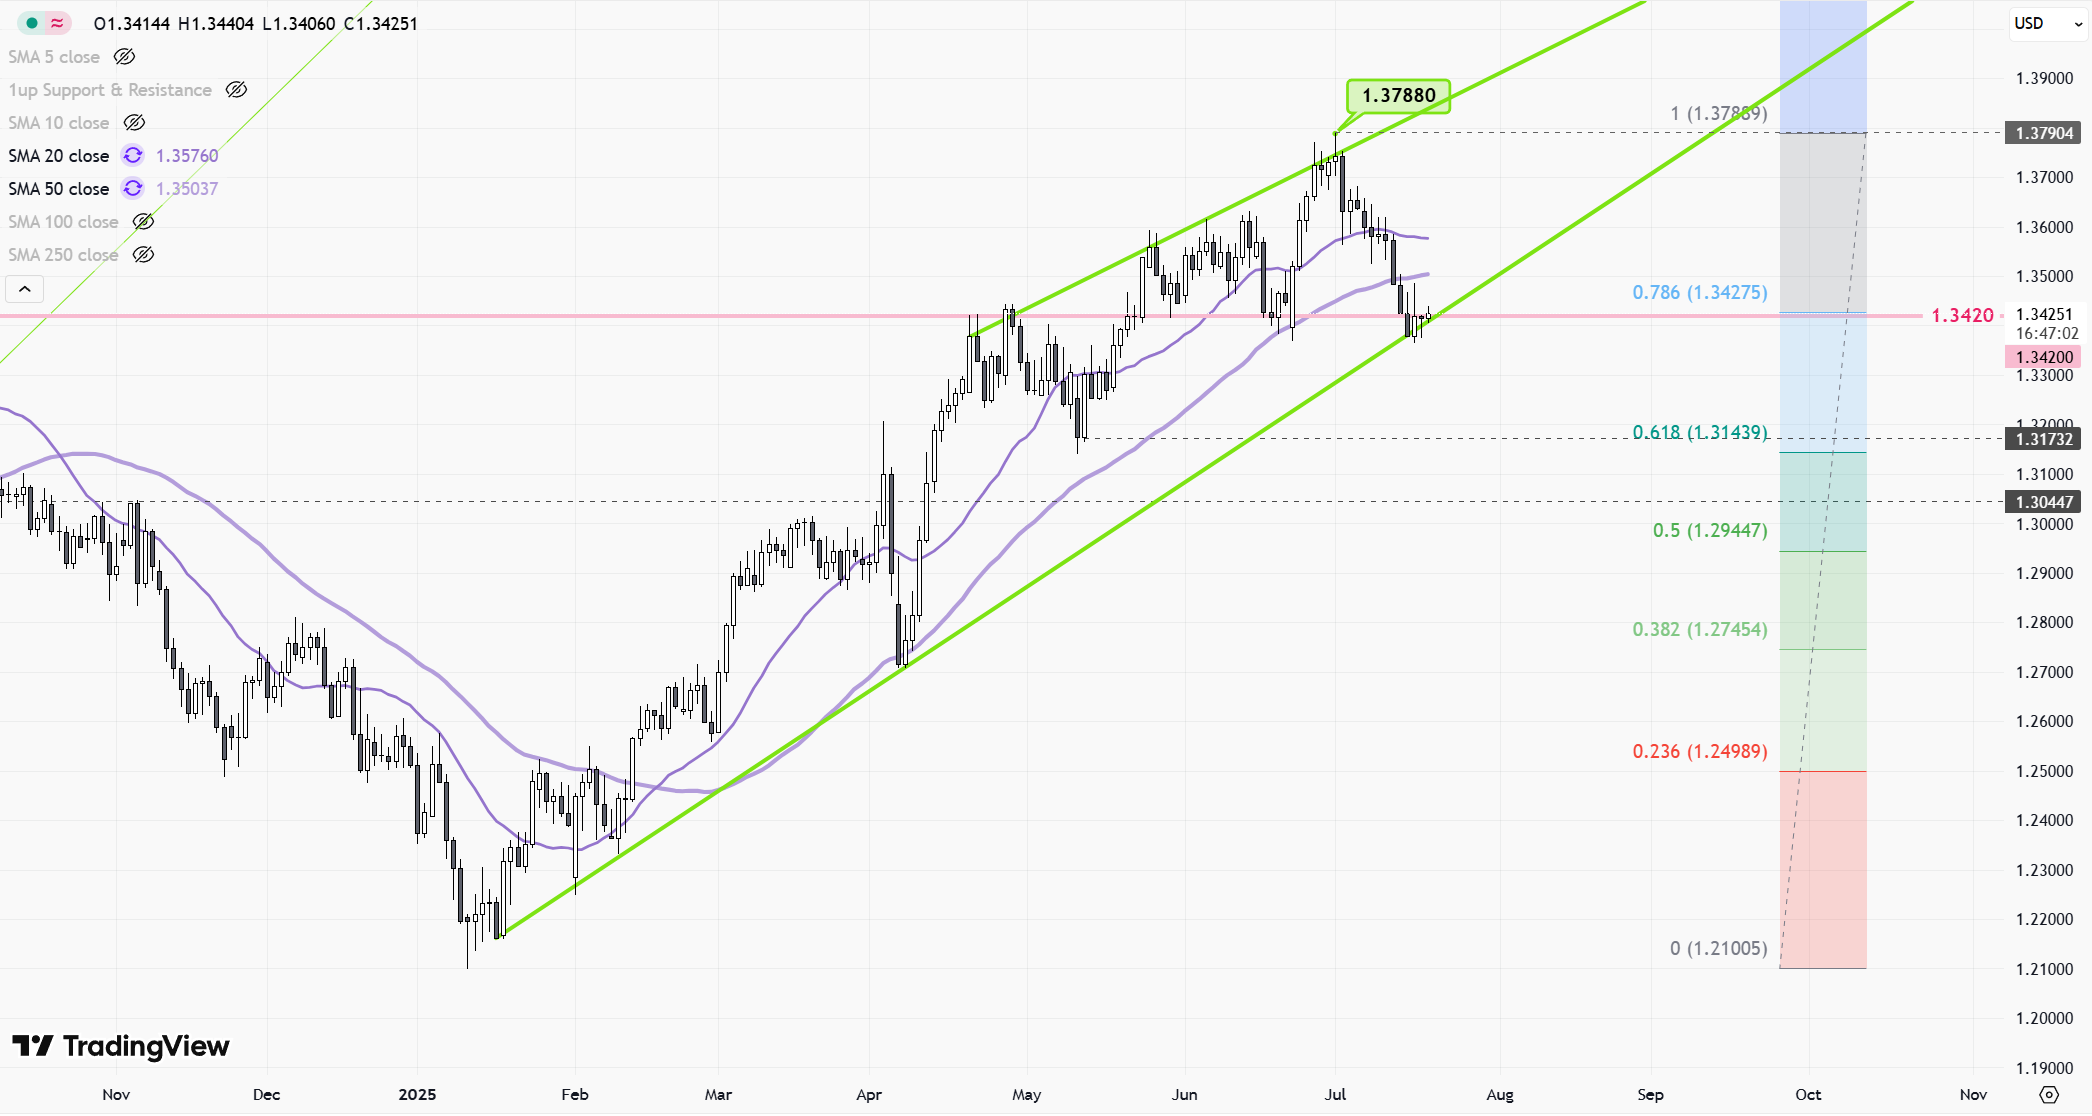
Over the past week, GBPUSD has continued its downward trend, extending an eight-session losing streak as the British pound faces pressure from a combination of domestic economic headwinds and renewed US dollar strength. The pair recently tested support around 1.3365 before correcting slightly to 1.3484, but technical signals point to further downside risks, with traders eyeing 1.3295 as the next key level. Fundamentally, UK data remains bleak—GDP contracted for a second consecutive month, and industrial output declined sharply, reinforcing expectations for potential BoE rate cuts later this summer. Meanwhile, in the US, robust labor market data and persistent inflation keep the Fed on hold, further widening the yield gap between US Treasuries and UK Gilts, which pressures GBP lower. Upcoming political and economic events, including potential US tariffs and upcoming CPI releases, could further influence GBPUSD volatility in the near term.
GBPUSD Daily Chart Analysis – July 18, 2025
Technical Indicators
– Moving Averages: The GBPUSD daily price action remains below descending moving average levels, reflecting persistent bearish momentum. On the 4H and daily timeframes, both key moving averages are trending downward, signaling an established downtrend.
– Oscillators: Momentum indicators such as the Marlin oscillator and likely the RSI are in negative territory, suggesting downside momentum remains intact and no immediate reversal is signaled.
– Price Envelope/Bollinger Band Structure: Recent price waves have gravitated toward the lower boundary of the price envelope, with corrections limited to midline retests, consistent with trending downside action.
Chart Patterns and Waves
– Wave Structure: Analysis based on Elliott wave and price matrix identifies a completed downward wave toward 1.3365, with corrective rebounds struggling to move beyond 1.3484 resistance. Short-term projections are for a further move lower toward the 1.3295 level.
– No Major Reversal Patterns: There is no evidence of classic reversal formations (head and shoulders, double bottoms) or substantial basing activity at current support. Instead, price is working within a wave sequence oriented lower.
Candlestick Patterns
– Recent Session Action: The approach to 1.3365 support was met with a minor corrective candle, hinting at attempted stabilization. However, neither a bullish engulfing nor a significant reversal candle (hammer, morning star) is noted, limiting conviction for buyers.
Trend Assessment
– Direction: GBPUSD is clearly in a downtrend, confirmed by position below key moving averages, negative oscillator readings, and repeated failures to break above short-term resistances. The trend has been reinforced by persistent lower highs and lower lows in recent sessions.
Key Support and Resistance Levels
– Major Support:
– 1.3365: Recent bounce zone; meaningful as a near-term line in the sand.
– 1.3295–1.3233: Below 1.3365, a broader demand zone exists, with historical consolidation in April–May marking 1.3233 as a significant level that may attract buyers or at least stall the decline.
– Major Resistance:
– 1.3484: Recent corrective rally capped at this pivot, now a strong barrier for any bullish attempt.
– Above that, no significant resistance is noted until the mid-high 1.35s, as focus remains on downside expansion.
Additional Insights
– Momentum & Volume: While volume is not visible, the continued move below moving average and declining structure typically signals sustained momentum pressure. Rate-sensitive macro drivers (such as an upcoming Fed decision) could inject volatility and reinforce current trends.
– Market Context: Short-term rebounds have quickly faded, confirming the bearish bias. An effective break below 1.3365 could set off acceleration toward the lower support zone around 1.3233.
Actionable Summary
GBPUSD remains entrenched in a bearish daily trend, with technical structure and indicator signals reinforcing further downside potential. Immediate downside targets are 1.3365 and, if breached, the broad 1.3295–1.3233 support band. Near-term rallies toward 1.3484 are likely to be capped by overhead resistance and present areas for position management or fresh entries favoring the primary trend. No major reversal signals are present; as such, the path of least resistance remains lower unless a material change in price action or macro outlook emerges.