


 |
| Gold V.1.3.1 signal Telegram Channel (English) |

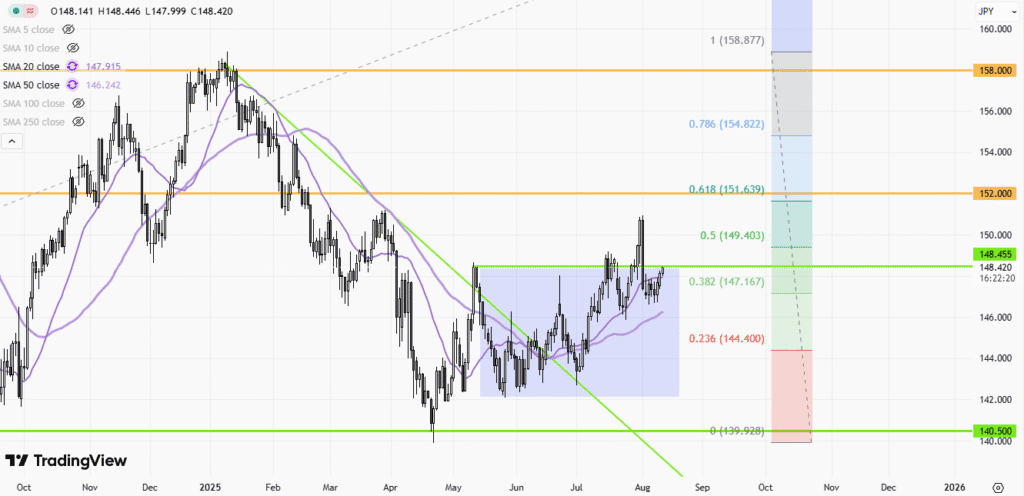
USDJPY Price Analysis: Key Technical Trading Outlook & Levels as Bulls Test Highs
2025-11-10 @ 15:40
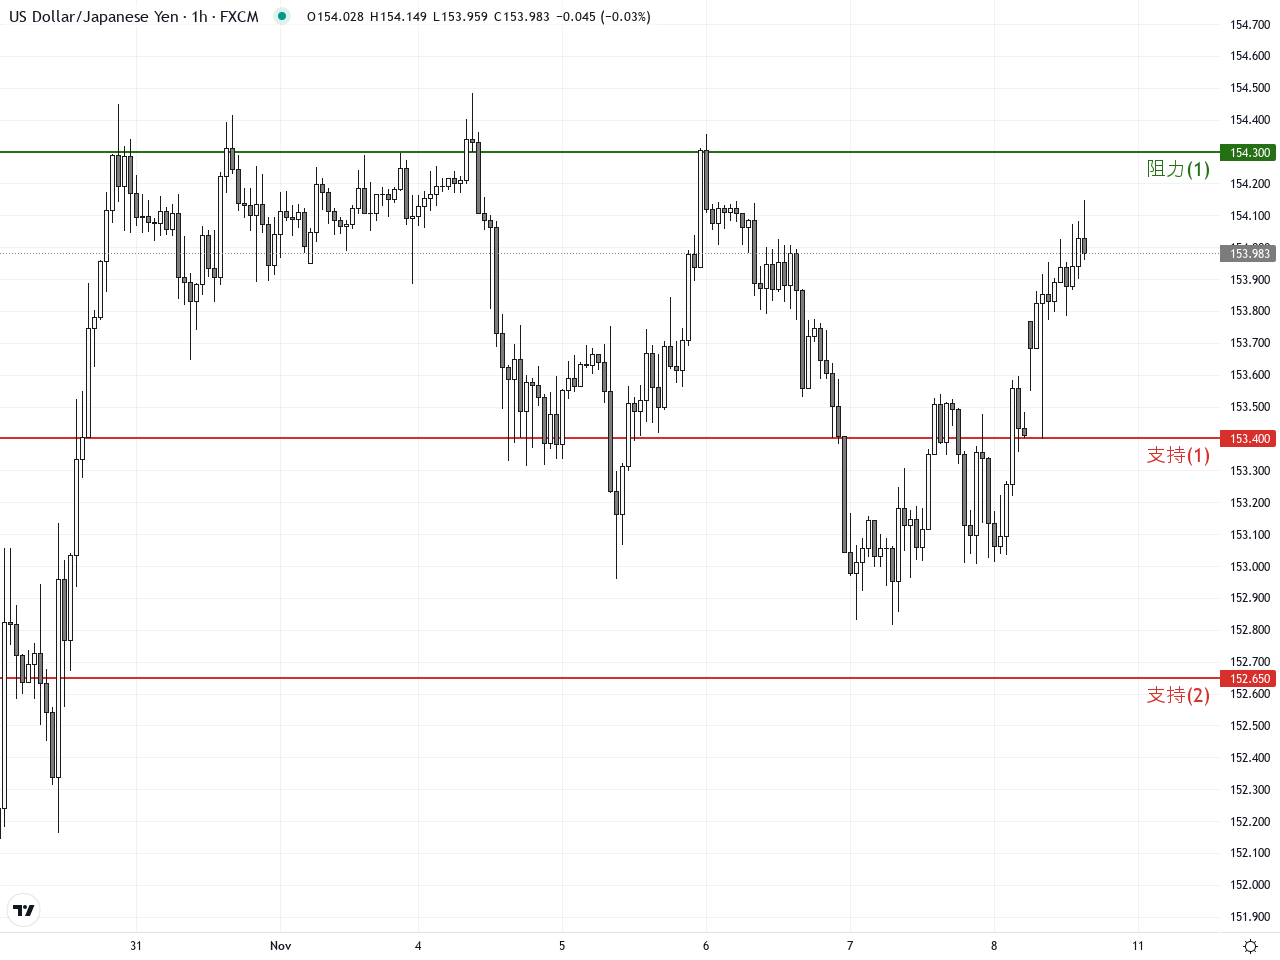
Over the past three trading days, USDJPY has shown a bullish tilt, consolidating near 154 with a last close at 153.97. Despite the lack of major news, technicals dominate sentiment: strong US-JP yield differentials keep the pair elevated, while traders eye possible corrections and renewed upside tests. Chart patterns indicate that as long as the 152.65 support level holds, bulls are likely to remain in control, with scope for a fresh move to recent highs. This choppy consolidation reflects investor caution regarding possible BOJ intervention and shifting US rates. A solid bounce from key supports may trigger a surge in trading volumes and new trading opportunities. The current USDJPY price analysis puts the spotlight on precise support resistance levels and momentum shifts that active traders need to watch closely.
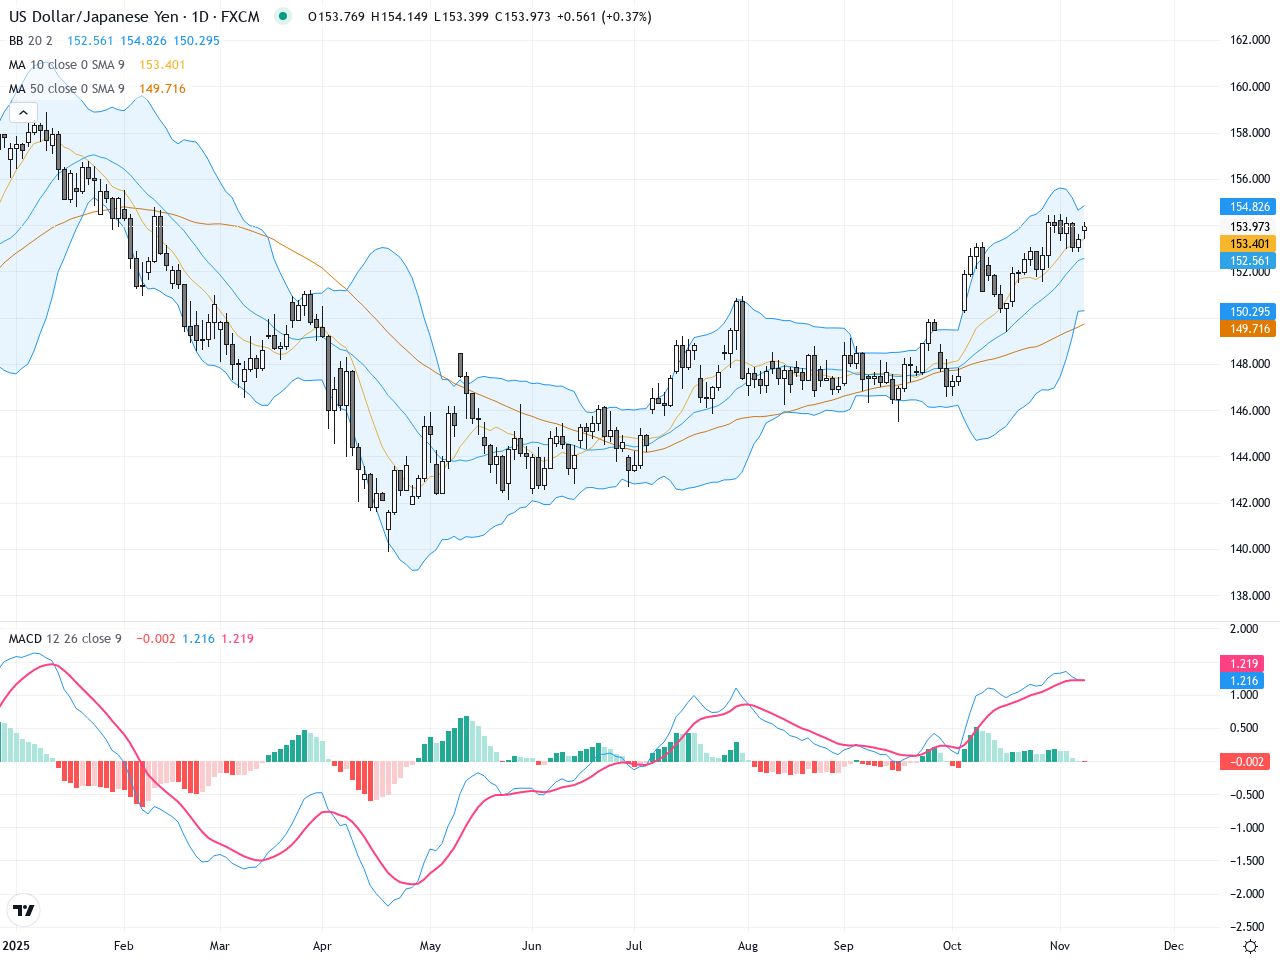
On the daily chart, USDJPY has been in a confident uptrend over the past 5 to 20 sessions, steadily rising from the low 151s and holding above short- and mid-term moving averages (MA5, MA20). The Bollinger Bands have widened, signaling higher volatility and continued momentum. MACD remains in a bullish crossover, suggesting the uptrend is intact, though a temporary pullback is not ruled out. The triangle consolidation pattern is nearing its apex—watch for a potential breakout to the upside, which could ignite the next leg up.
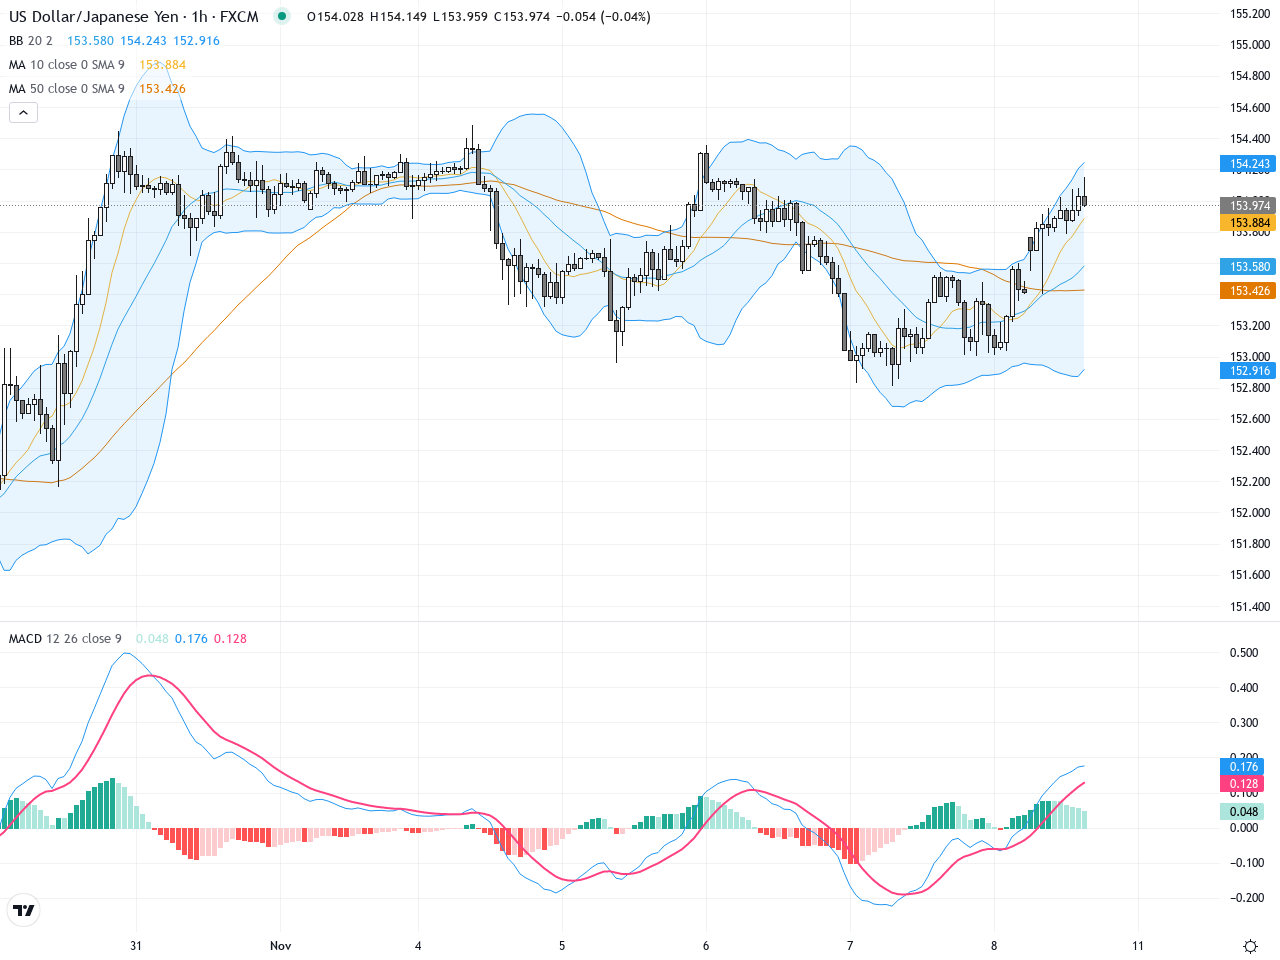
The hourly chart shows USDJPY trading in a tight consolidation between 153.5 and 154.3 following a strong impulse higher. A recent bearish engulfing pattern (dark cloud cover) triggered a mild pullback, hinting at short-term correction risk. Moving averages are clustered, and MACD remains above zero but is losing steam—momentum is evenly balanced. An hourly close above 154.30 could open the door for a fresh bullish run, while a drop below 153.40 would indicate deeper retracement potential.
Technical Trend: Resilient range-bound bullishness
Technically, the daily triangle pattern is entering a make-or-break phase. The most recent key candlestick pattern on the hourly is a bearish engulfing, signaling possible weakness in the next 24 hours, but the higher time frame uptrend remains dominant. MACD momentum has flattened, foreshadowing a period of range-bound action. Watch for a surge in volume on a breakout move for the next high-conviction trade. Strategy: harvest the range between resistance and support, and wait for a clear technical catalyst.
Resistance & Support
<
p style=”padding: 10px; margin: 20px 0; border: solid 1px #fa003f; border-radius: 5px;”>The above financial market data, quotes, charts, statistics, exchange rates, news, research, analysis, buy or sell ratings, financial education, and other information are for reference only. Before making any trades based on this information, you should consult independent professional advice to verify pricing data or obtain more detailed market information. 1uptick.com should not be regarded as soliciting any subscriber or visitor to execute any trade. You are solely responsible for all of your own trading decisions.