Category: Technical Analysis

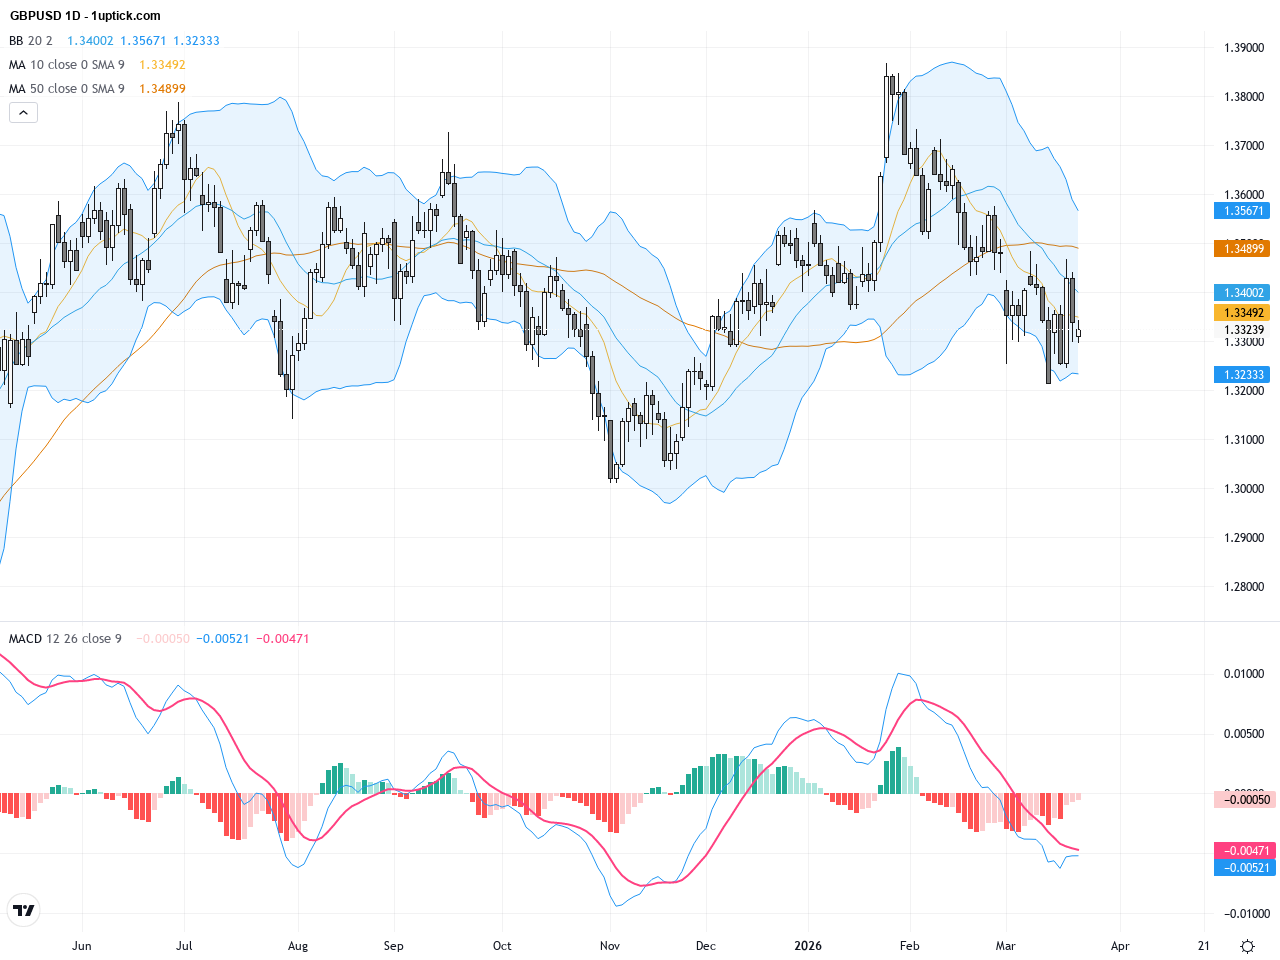
GBPUSD Approaches Key Resistance at 1.3437 Ahead of UK February CPI Data

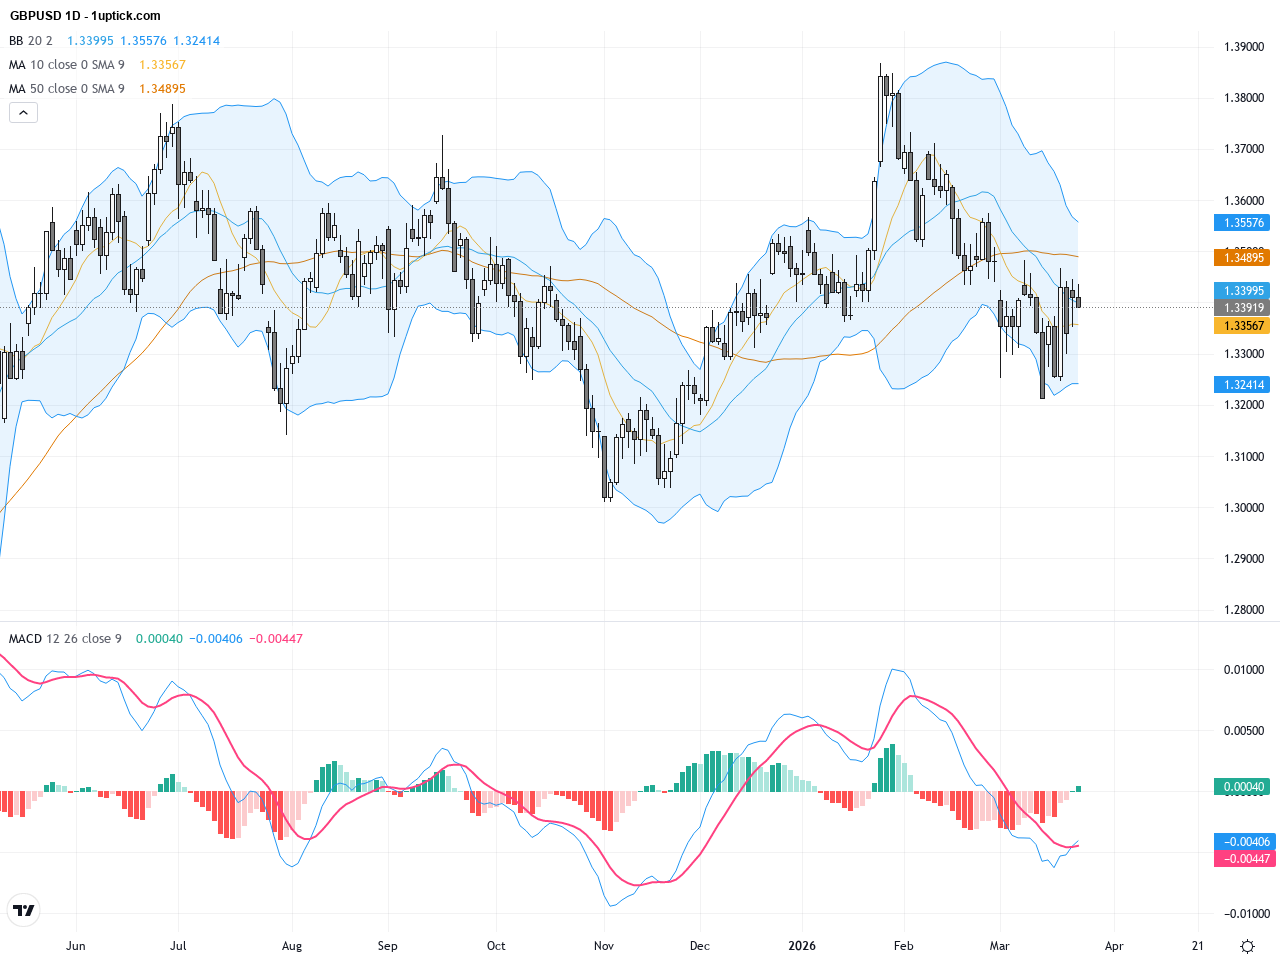
Over the past three trading days, GBPUSD has shown notable price volatility, closing slightly lower at 1.3392. Market sentiment is influenced by expectations around the upcoming UK February Consumer Price Index (CPI) release, the Bank of England’s hawkish outlook, and the prevailing strength of the US dollar amid geopolitical tensions. The pair holds steady near the 1.34 level as traders brace for inflation data that may reshape short-term trading prospects. For the average investor, this means the British pound is caught between supportive hawkish signals and pressure from rising global energy prices and a strong dollar, maintaining the pair in a sensitive trading range.

USDJPY Rebounds Towards 160: Key Resistance and Technical Patterns Explained

Over the past three trading days, USDJPY has rebounded strongly after finding support around the 20-day simple moving average near 158.10, closing yesterday at 158.813. Rising geopolitical tensions, especially around the Iran conflict, have bolstered the U.S. dollar while pressuring the Japanese yen, creating notable volatility. The market now eyes critical psychological resistance levels at 159.00 and 160.00. For investors, the mood this week remains cautiously bullish for the dollar amid safe-haven demand, while concerns about potential Bank of Japan intervention linger. These combined factors shape the current USDJPY price analysis and trading outlook.

EURUSD: RSI Rebound Signals Short-Term Bounce but Bearish Bias Below 1.1600 Persists

Over the past three trading days, EURUSD has hovered near the critical 1.16 level, closing around 1.16232, reflecting ongoing pressure on the Euro against the US Dollar amid rising eurozone energy concerns and weak economic data. Recent market news highlights escalating oil prices negatively impacting eurozone growth and inflation expectations, prompting the ECB towards a dovish stance and weighing on the Euro. Investors remain risk-averse amid geopolitical uncertainties and central bank watchfulness, driving the price action lower. For the average investor, this suggests careful attention to resistance areas and support levels to manage downside risk amid volatile sentiments.

AUDUSD: AI Commodity Boom Drives Australian Dollar Rally with Key Technical Patterns in Play

The AUDUSD currency pair has shown resilient volatility near yesterday’s closing price of 0.69939, influenced by geopolitical tensions around the Strait of Hormuz and an upgraded Australian dollar outlook by Barclays. Over the past three trading days, the Australian dollar gained support from rising commodity demand and positive domestic economic signals. Barclays highlighted the accelerating AI-driven commodity boom as a key bullish driver for the Aussie. For the average investor, this means amid recovering global risk appetite, the AUD is positioned well to benefit from commodity strength and economic improvement, suggesting a potential for steady upward moves in the near term. Traders should watch the 0.6944 support level closely alongside evolving geopolitical dynamics.

USDCAD: Key Technical Breakout Resistance at 1.3730 Signals Cautiously Bullish Trading Outlook

Over the past three trading days, USDCAD displayed heightened volatility, closing yesterday at 1.37553. The postponement of US military strikes on Iran triggered a risk-on sentiment, weighing on the US dollar and causing a brief Canadian dollar rally followed by a pullback. Traders remain cautiously optimistic, closely watching the crucial 1.3730 resistance level. For everyday investors, this means short-term price moves are heavily influenced by geopolitical developments and risk appetite shifts. Monitoring key technical patterns and breaking news is essential to navigating the current USDCAD trading environment.

WTI Crude Oil: Key Support Holds After Sharp Selloff, Critical Trading Outlook

WTI Crude Oil experienced dramatic volatility over the past three trading days. After peaking near $98.32 on March 20, prices plunged sharply to close at $88.13 on March 23, marking a fall of over 10%. This drastic movement was primarily driven by President Trump’s announcement of postponing strikes on Iran’s energy infrastructure and mentioning ‘productive talks’ between the US and Iran, which softened geopolitical risk sentiment and led to a market pullback. For the average investor, this highlights how geopolitical news can swiftly alter crude oil prices. Caution is advised as the market seeks stability around critical support levels, and traders should monitor supply-demand factors and regional tensions closely going forward.

XAUUSD Breaks Key Support at 4400: In-Depth Gold Technical and Fundamental Analysis

Over the past three trading days, XAUUSD has witnessed significant volatility, plunging from a high of 4650 USD on March 19 to close at 4411 USD yesterday (March 23), a near 5% decline. The market turmoil this week was driven primarily by geopolitical tensions and easing oil prices, especially related to Iran, which shifted risk sentiment and led gold prices to stabilize around 4400. Additionally, Trump’s “TACO Trade” has returned in 2026, providing traders with a consistent edge supporting gold. For average investors, this means gold is currently in a consolidation phase, pressured short term but still holding rebound potential. Key technical levels and market news should be monitored closely moving forward.

GBPUSD Technical Breakout: Key Support and Resistance Levels to Watch

GBPUSD has faced downward pressure amid signs of structural weakness in the US Dollar Index (DXY). Over the past three trading days, the pair hovered near yesterday’s 1.3323 closing level before slipping lower, influenced by cautious investor sentiment ahead of pivotal central bank meetings. Political uncertainties and rising energy prices add to market volatility. Technically, GBPUSD broke below its critical ascending trendline, signaling potential for further downside. For the average investor, this means a moment to tighten risk controls and monitor if key support zones hold. The market mood remains reserved as traders await fresh catalysts from this week’s economic data releases.

USDJPY Technical & Fundamental Analysis: Key Breakout Near 159.50 and Intraday Support Levels

Over the past three trading days, USDJPY has hovered around the 159 level, driven by geopolitical tensions and a strong US dollar. The pair climbed steadily from an opening of 159.22 to close yesterday at 159.52. U.S.-Iran conflict fears and volatility in the US stock market heightened demand for the dollar, while the Japanese yen remained under pressure. Market participants are cautious ahead of potential intervention from the Bank of Japan as USDJPY approaches key resistance between 159.50 and 160. For investors, this combination of fundamental and geopolitical factors sets the tone for a potentially volatile yet upward-biased trading environment.

EURUSD: Downtrend Intensifies with Key Support and Middle East Geopolitical Risks in Focus

Over the past three trading days, EURUSD has continued its downward pressure, slipping gradually from around 1.16 to a closing price of 1.15458 yesterday. Heightened geopolitical tensions in the Middle East have spurred demand for the US dollar as a safe haven, pressuring the euro lower. Recent market news highlights Iran’s response to the US 48-hour ultimatum, pushing oil prices higher and exacerbating European energy cost worries. For the average investor, this means EURUSD may face near to medium-term downside risks, especially given Europe’s reliance on energy imports and the current dollar strength. This week’s technical charts also display a clear bearish trend with critical support and resistance levels to watch. Investors should track economic data releases and geopolitical developments closely to adjust their trading strategies accordingly.

1uptick Analytics @

Maximize your profit at ease

Risk Warning​

*Investment involves risk. You may use the information, strategies and trading signals on this website for academic and reference purposes at your own discretion. 1uptick cannot and does not guarantee that any current or future buy or sell comments and messages posted on this website/app will be profitable. Past performance is not necessarily indicative of future performance. It is impossible for 1uptick to make such guarantees and users should not make such assumptions. Readers should seek independent professional advice before executing a transaction. 1uptick will not solicit any subscribers or visitors to execute any transactions, and you are responsible for all executed transactions.

© 2022-25 – 1uptick Analytics all rights reserved.


Risk Warning​

*Investment involves risk. You may use the information, strategies and trading signals on this website for academic and reference purposes at your own discretion. 1uptick cannot and does not guarantee that any current or future buy or sell comments and messages posted on this website/app will be profitable. Past performance is not necessarily indicative of future performance. It is impossible for 1uptick to make such guarantees and users should not make such assumptions. Readers should seek independent professional advice before executing a transaction. 1uptick will not solicit any subscribers or visitors to execute any transactions, and you are responsible for all executed transactions.

© 1uptick Analytics all rights reserved.

Home
Analysis
Calendar
Tools
Signals