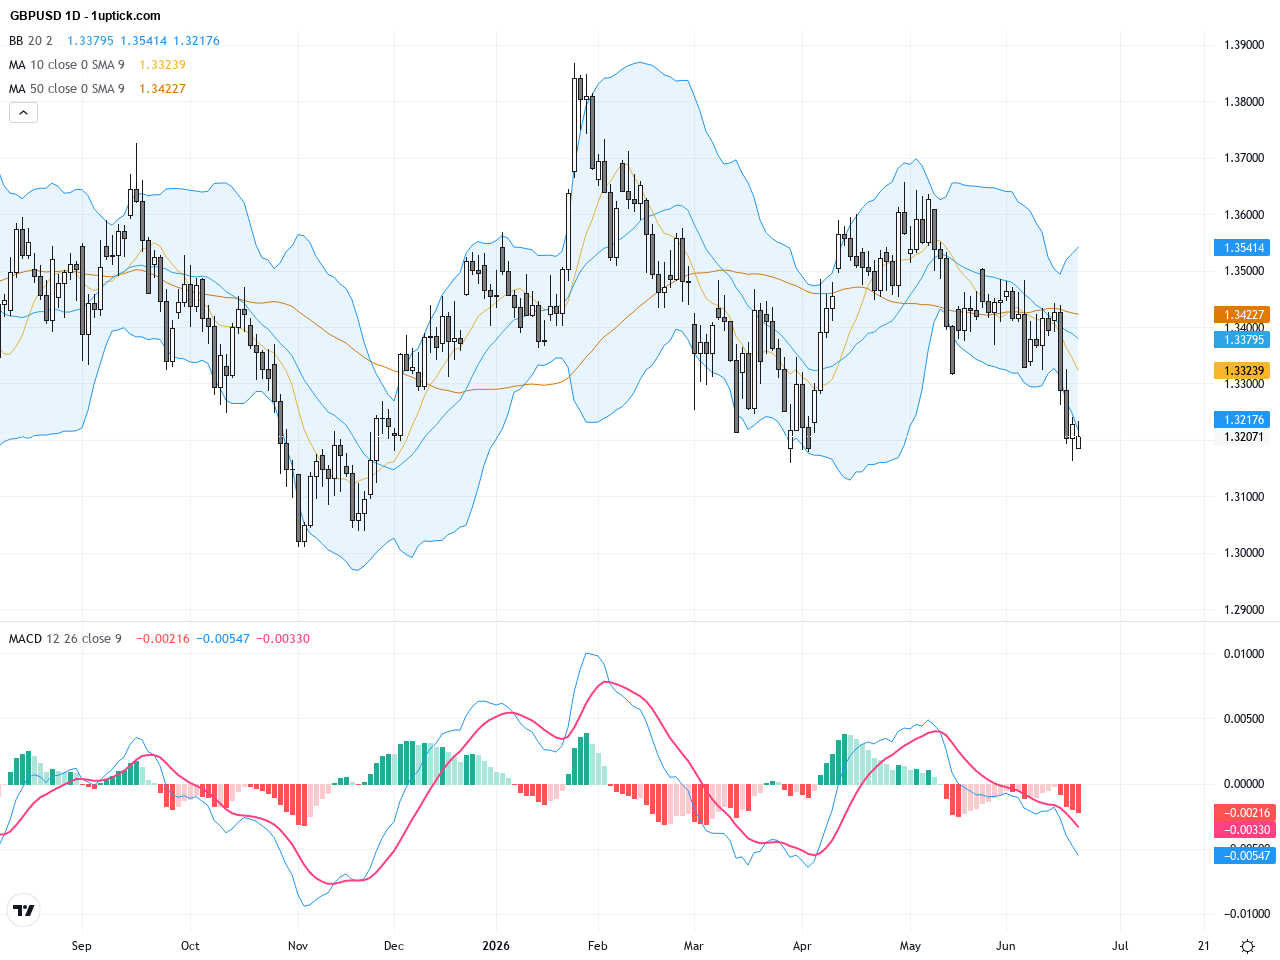
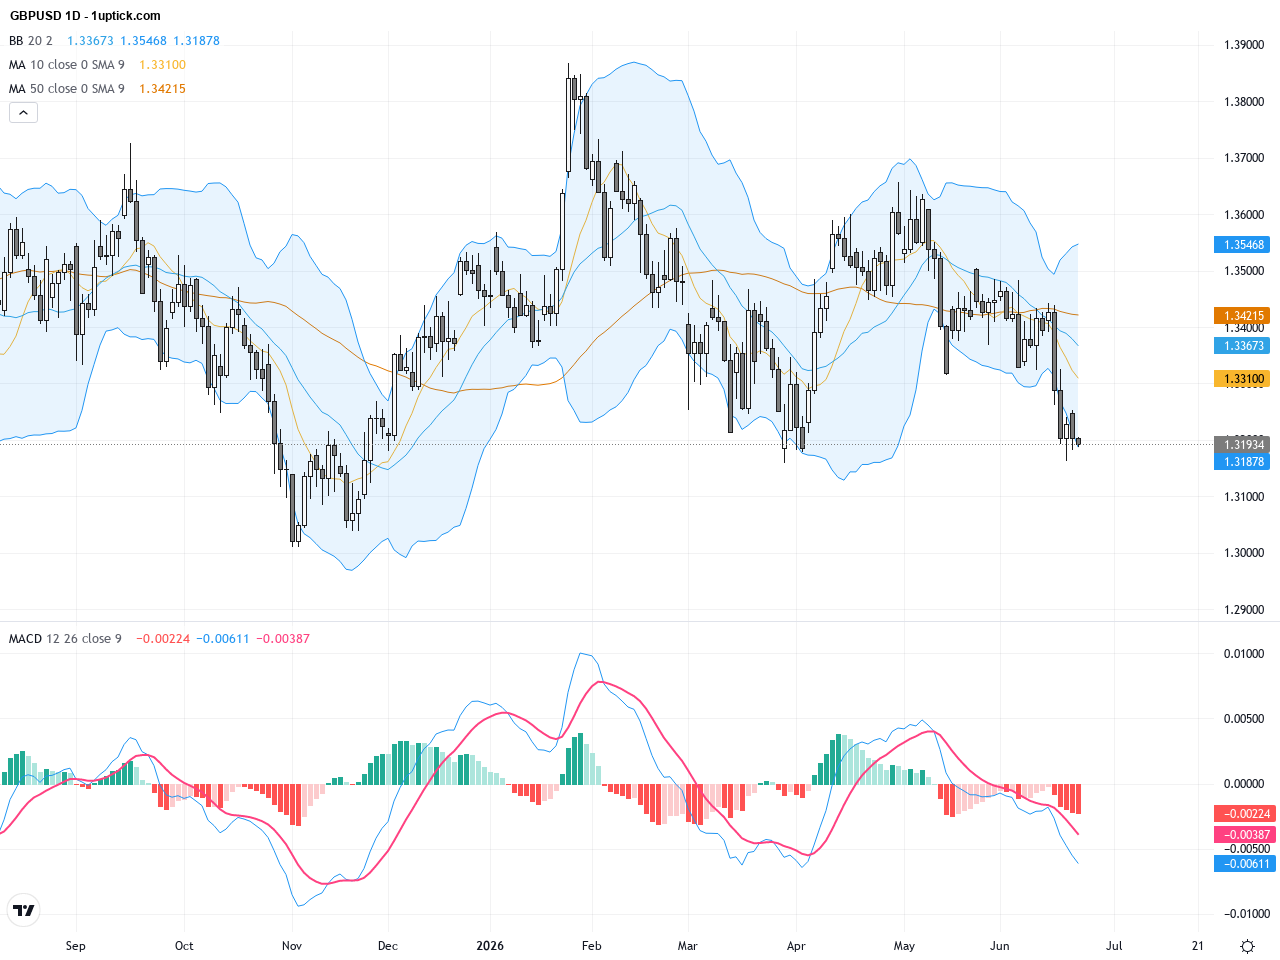
Category: Technical Analysis

USDCAD Nears Seven-Month High, Breaking Key 1.41 Resistance with Bullish Trading Outlook, June 18, 2026

Over the past three trading days, USDCAD has maintained strong momentum, breaking through the key 1.41 level after some consolidation. The pair has been influenced by the upcoming FOMC rate decision and falling oil prices, which have supported the US dollar’s strength against the slightly resilient Canadian dollar. Geopolitical developments between the US and Iran have also injected some volatility, driving the pair towards a seven-month peak. For the average investor, this suggests short-term US dollar strength but with caution due to the commodity linkage of CAD. Technically, USDCAD is testing a significant resistance zone, and a confirmed breakout here could pave the way for further gains.

WTI Crude Oil: Navigating Key Support Amid Technical Downtrend and Geopolitical News, June 18, 2026

WTI Crude Oil has experienced significant volatility over the past three trading days, dropping from a high of $80.75 on June 15 to close near $76.01 on June 17. This price movement was largely influenced by geopolitical developments including a U.S.-Iran ceasefire deal and expectations around the reopening of the Strait of Hormuz, which have pressured oil supply outlooks. Investors are closely monitoring these developments as they directly impact the trading outlook, support and resistance levels, and market sentiment for WTI. The recent news and price actions collectively underscore a cautious market mood with potential for key technical transitions.

XAUUSD Technical and Fundamental Report: Gold Rebounds Signal Strong Support Levels, June 18, 2026

Over the past three trading days, XAUUSD has experienced increased volatility with consolidation near the 4259.88 close of yesterday. Gold prices have rebounded, influenced by easing Middle East tensions and softer U.S. inflation expectations. Recent market news highlights support from Chinese buying and central bank purchases, alongside cautious positioning ahead of the upcoming Fed decision. This blend of fundamental drivers suggests gold remains both a safe haven and a potential growth asset. Traders should watch for key technical patterns and market news to capitalize on emerging opportunities.

GBPUSD: Optimism on US-Iran Peace Boosts Cable Amid Key Technical Patterns, June 17, 2026

Over the past three trading days, GBPUSD modestly climbed above yesterday’s close of 1.34308, lifted by positive developments in US-Iran peace talks. This geopolitical breakthrough improved risk sentiment and exerted downward pressure on the US dollar, supporting the British pound above the psychologically important 1.3400 level. Despite softer UK GDP growth and mixed signals around Bank of England’s potential hikes, the currency pair remains in play. For everyday investors, such geopolitical optimism suggests potential upside but requires vigilance around economic data and central bank moves to manage risk effectively.

USDJPY Technical Outlook: Key Resistance at 160 Amid BOJ Rate Hike and Market Shifts, June 17, 2026

Over the past three trading days, the USDJPY has hovered around 160.33, with a slight dip yesterday. Market sentiment was influenced by recent headlines about prospects of peace between the US and Iran, which pressured the dollar, while the Bank of Japan unexpectedly raised its interest rate to 1%, the highest since 1995, yet the yen remained weak, keeping USDJPY elevated. This dynamic illustrates the forex market’s sensitivity to geopolitical developments and central bank policy surprises. For the average investor, it’s like navigating through a stormy weather with fluctuating currency winds. Looking ahead, focus will remain on today’s US Federal Reserve policy decision and key Japanese trade data to guide USDJPY’s next directional move.

EURUSD: ECB Rate Hike Sparks Consolidation Below Key 200-Day EMA, June 17, 2026

EURUSD has displayed notable price volatility over the past three trading days, closing at 1.16146 amid market reactions to the European Central Bank’s first rate hike since 2023. Meanwhile, the Bank of Japan’s historic rate increase to 1% failed to move markets significantly as it was already priced in. The EUR/USD pair now struggles just below its 200-day exponential moving average, with investors eyeing the upcoming FOMC meeting and Fed Chair Warsh’s first policy stance. This week’s price movement reveals a cautious market digesting recent monetary policy shifts, pushing EURUSD into a short-term consolidation phase. For average investors, it means the market is pausing after a key signal to assess the next likely direction.

AUDUSD: Bullish Momentum Surges as Key Resistance Areas Come Into Focus, June 17, 2026

Over the past three trading days, AUDUSD rebounded from a two-month low of 0.6977 to close near 0.7067, reflecting a gradual return of buying interest. Market optimism was driven by the prospect of a US-Iran peace deal and the Reserve Bank of Australia’s (RBA) expected decision to hold the interest rate steady at 4.35%. These developments have fueled bullish sentiment, placing AUDUSD in a consolidation band between 0.7100 and 0.7200. Investors should watch for key resistance levels and upcoming economic data releases that may influence price volatility in the near term.

USDCAD: Breakout Above 1.40 Signals Strong Dollar Amid Oil Price Collapse, June 16, 2026

USDCAD has been trading in a range between 1.39 and 1.40 recently, with yesterday’s close at 1.40108. The pair’s momentum was buoyed by optimism over US-Iran peace prospects and a steep drop in oil prices, which typically benefits the US dollar against the Canadian dollar. Despite a brief rebound in CAD following the Bank of Canada rate decision, the USD remains supported by safe-haven demand and energy price declines. Traders should watch if the 1.40 level can now act as solid support and monitor upcoming Canadian and US economic releases for further directional cues. This week’s price action reflects both fundamental drivers and technical confirmation for ongoing USD strength.

WTI Crude Oil: US-Iran Deal Sparks Sharp Drop to Three-Month Lows Amid Hormuz Strait Reopening, June 16, 2026

WTI Crude Oil has experienced significant volatility over the past three trading days, closing yesterday at $80.75, slightly down from the prior day. The US and Iran reached a tentative 60-day ceasefire agreement including the reopening of the critical Strait of Hormuz, triggering sharp declines in oil prices from March highs. This deal reduces geopolitical risk and supply concerns, buoying global stock markets — particularly the Nasdaq. For the average investor, this development suggests a near-term easing of energy price pressures but raises caution for potential future fluctuations depending on how the peace agreement progresses.

XAUUSD: Gold Rallies on Iran Deal News with Key Technical Patterns Pointing Upward, June 16, 2026

Over the past three trading days, XAUUSD has demonstrated a strong rebound driven by the news of a ceasefire deal between the U.S. and Iran, closing yesterday at 4310.6 after rising significantly from early June lows. The easing of Middle Eastern geopolitical tensions has led traders back into gold, pressuring the dollar and oil prices while improving market risk sentiment. For the average investor, this feels like a breathing space after crisis, with gold regaining its allure as a safe-haven asset. Overall, XAUUSD is regaining upward momentum but remains sensitive to ongoing global macroeconomic data and geopolitical developments.

1uptick Analytics @

Risk Warning​

*Investment involves risk. You may use the information, strategies and trading signals on this website for academic and reference purposes at your own discretion. 1uptick cannot and does not guarantee that any current or future buy or sell comments and messages posted on this website/app will be profitable. Past performance is not necessarily indicative of future performance. It is impossible for 1uptick to make such guarantees and users should not make such assumptions. Readers should seek independent professional advice before executing a transaction. 1uptick will not solicit any subscribers or visitors to execute any transactions, and you are responsible for all executed transactions.

© 2022-26 1uptick Analytics all rights reserved.


Risk Warning​

*Investment involves risk. You may use the information, strategies and trading signals on this website for academic and reference purposes at your own discretion. 1uptick cannot and does not guarantee that any current or future buy or sell comments and messages posted on this website/app will be profitable. Past performance is not necessarily indicative of future performance. It is impossible for 1uptick to make such guarantees and users should not make such assumptions. Readers should seek independent professional advice before executing a transaction. 1uptick will not solicit any subscribers or visitors to execute any transactions, and you are responsible for all executed transactions.

© 1uptick Analytics all rights reserved.

Home
.AI
Analysis
Calendar
Tools