Technical Analysis
Evaluate price trends and patterns, identify potential investments and trading opportunities!

EURUSD-1 hour
Market Overview EURUSD traded lower over the past week, retreating from recent highs above 1.18 to near 1.17 as the pair corrected after breaking a technical channel in early July. The pullback coincided with renewed…

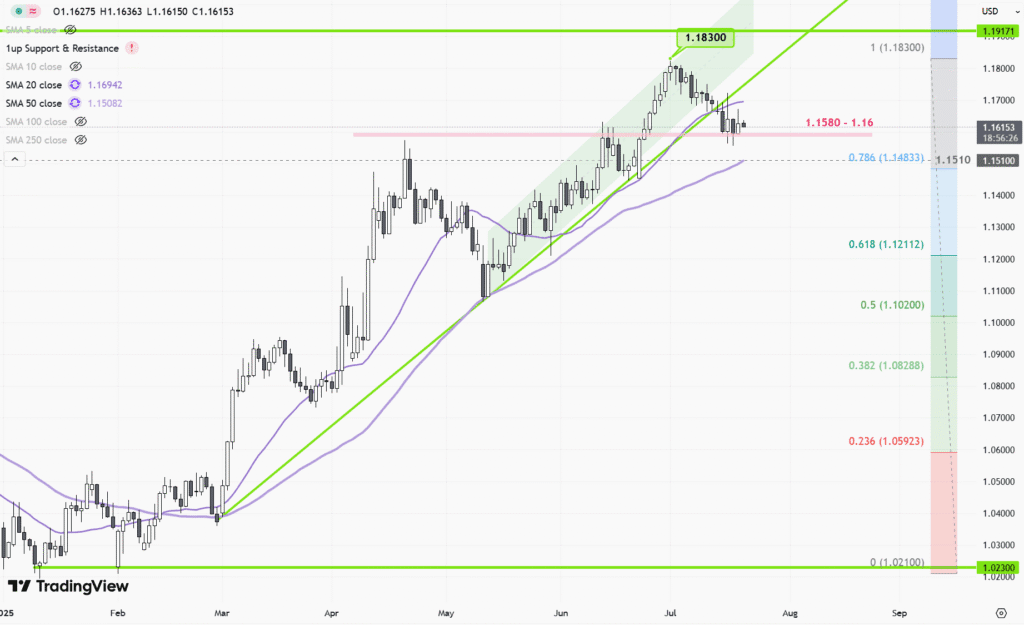
EURUSD-1 hour
Market Overview EURUSD has experienced a moderate pullback over the past week, dropping from near 1.1826 to around 1.1690. This decline comes after the euro broke its previous technical support, coinciding with a stronger US…
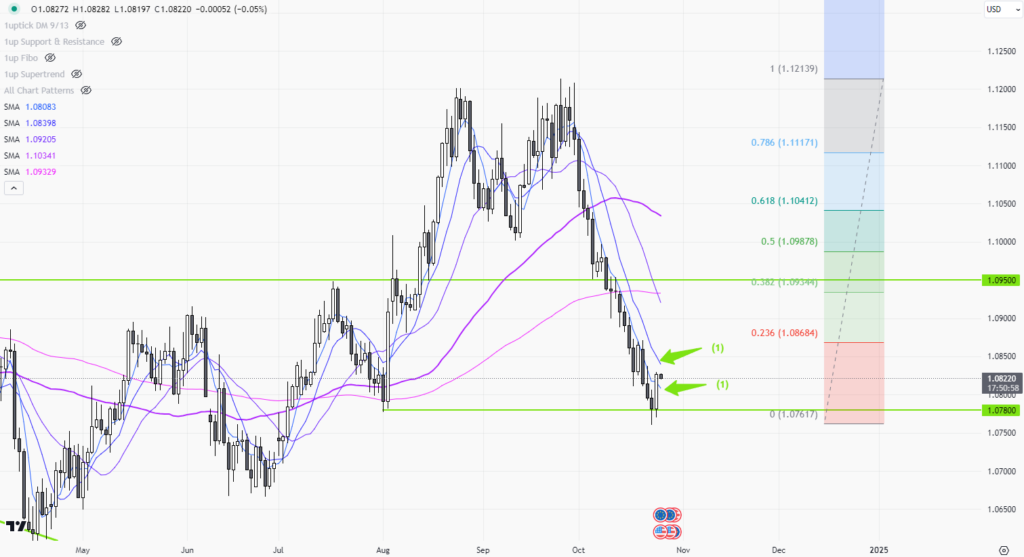
EURUSD-Daily
Market Overview Over the past week, EURUSD experienced a moderate decline, slipping from around 1.1779 on July 4 to 1.1689 by July 11. This drop was primarily driven by a stronger US dollar after the…
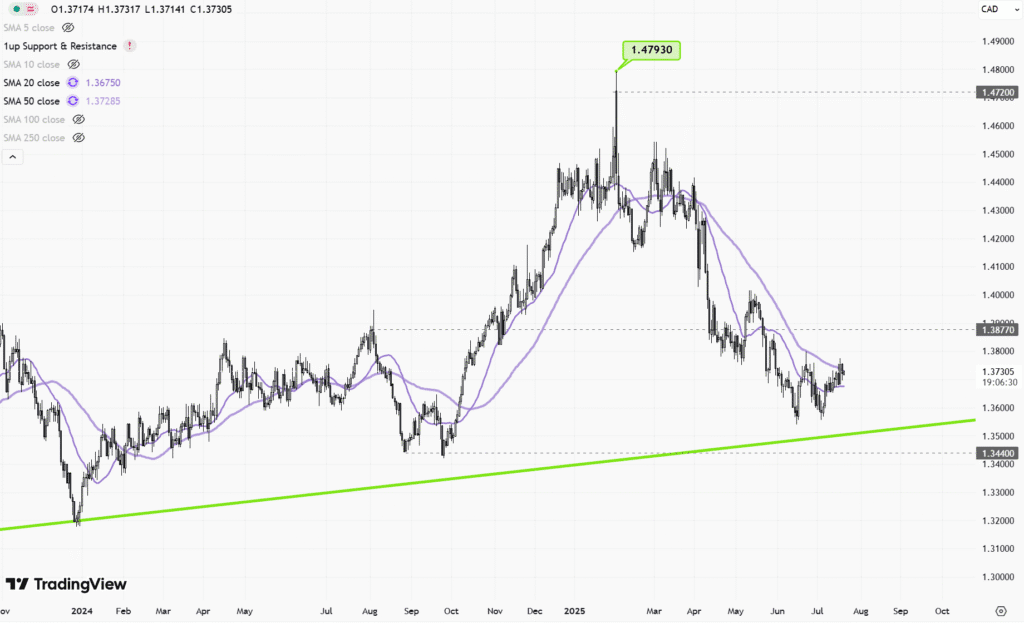
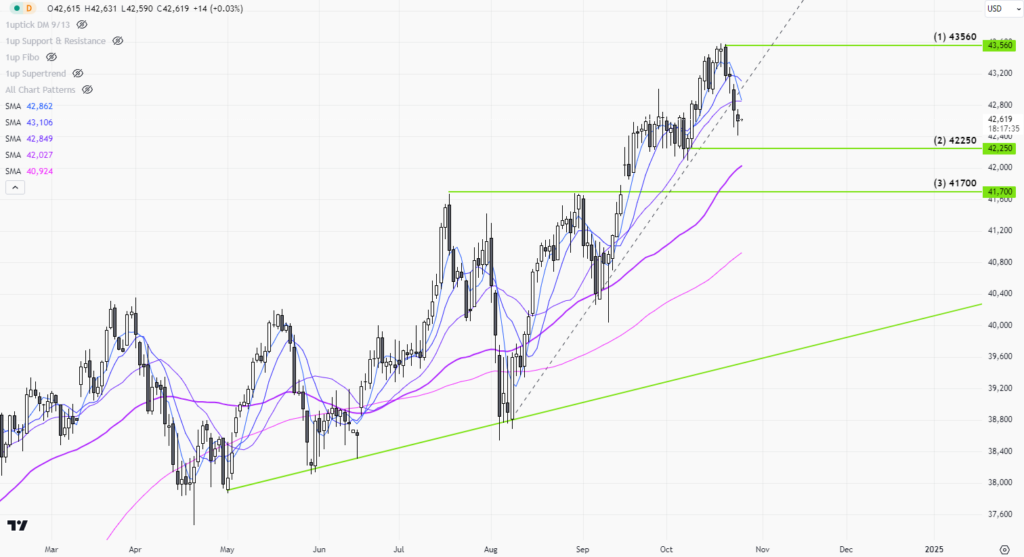
USDCAD-Daily
Market Overview The USDCAD traded in a tight range over the past week, fluctuating between 1.3650 and 1.3730. Price action was shaped by competing factors: a surge in trade tensions following the announcement of new…
GBPUSD-Daily
Market Overview Over the past week, GBPUSD has continued its downward trend, extending an eight-session losing streak as the British pound faces pressure from a combination of domestic economic headwinds and renewed US dollar strength.…
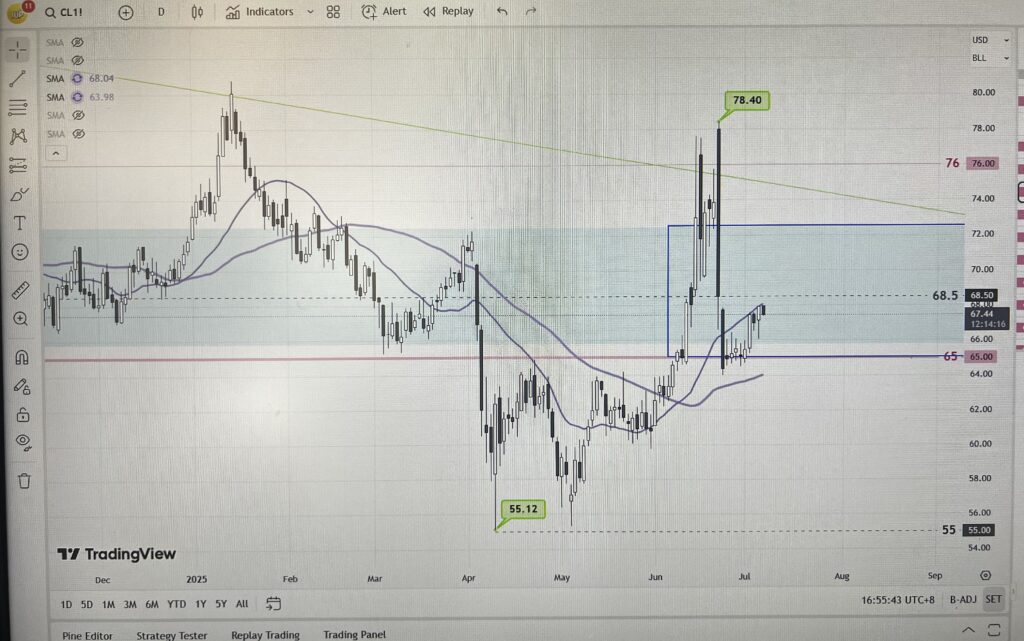
CLc1-Daily
Market Overview CLc1 crude oil futures saw moderate price fluctuation over the past week, with WTI crude trading between $67.5 and $67.7 per barrel. The market experienced downward pressure primarily due to concerns over global…
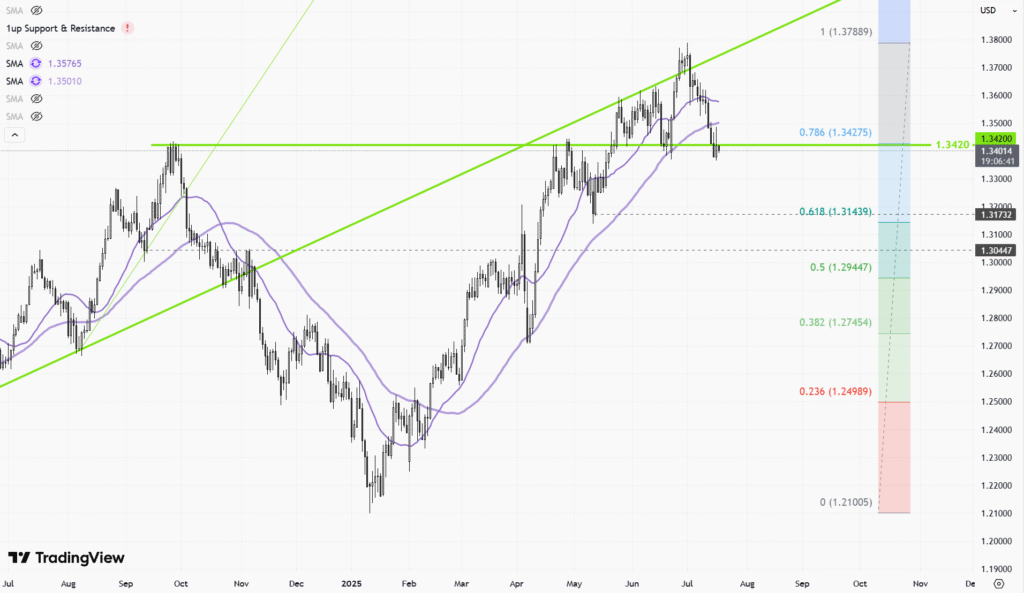
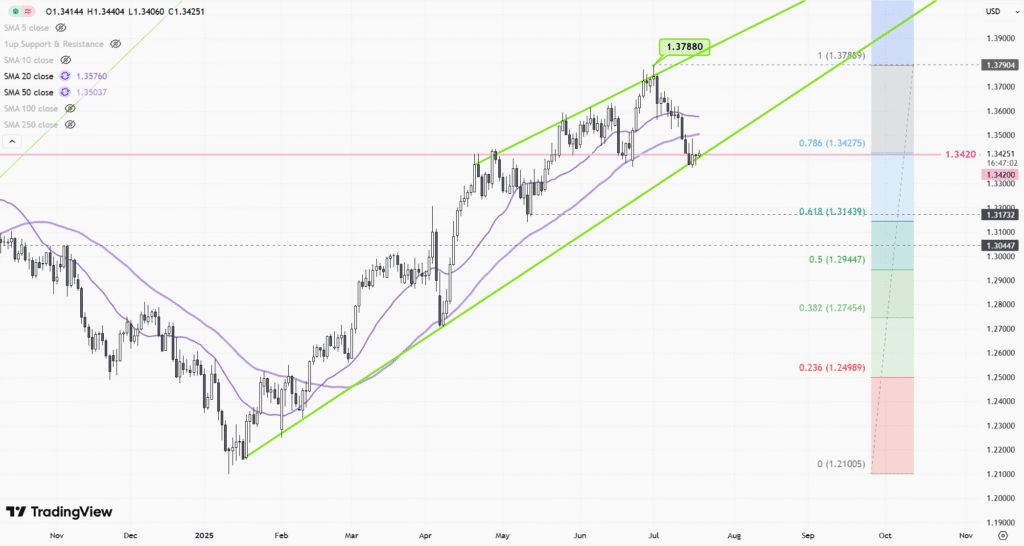
GBPUSD-Daily
https://int.1uptick.com/wp-content/uploads/2025/07/FX-GBPUSD-Daily-2025-07-17T085359.9310700.png” Market Overview GBPUSD experienced sustained downward pressure over the past week, falling from highs around 1.3480 to lows near 1.3400 as the pair endured an eight-day losing streak. This recent decline comes after several…


Latest FX Analysis

Latest Gold Analysis