Technical Analysis
Evaluate price trends and patterns, identify potential investments and trading opportunities!
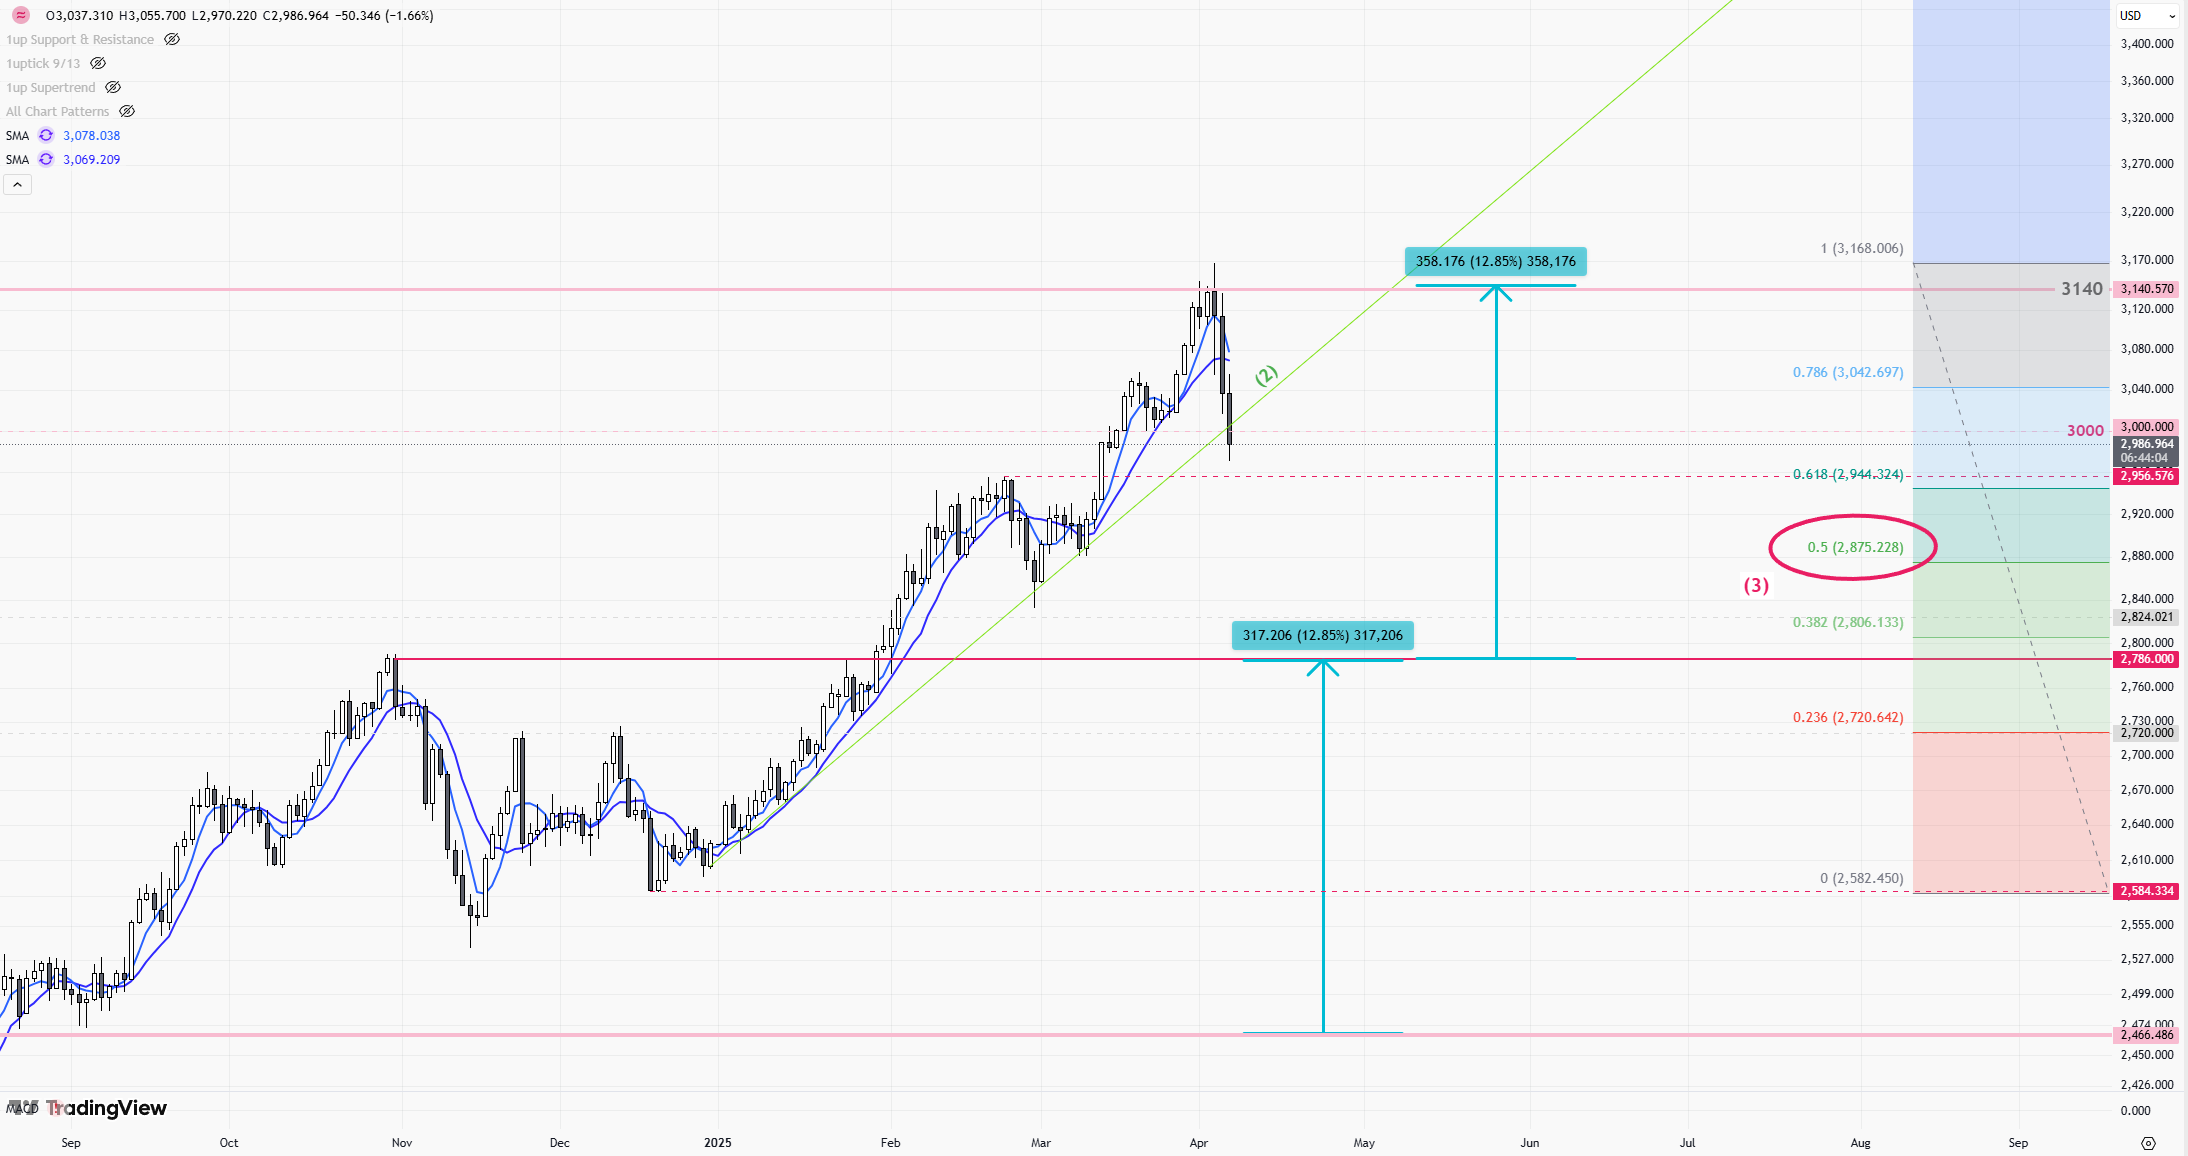
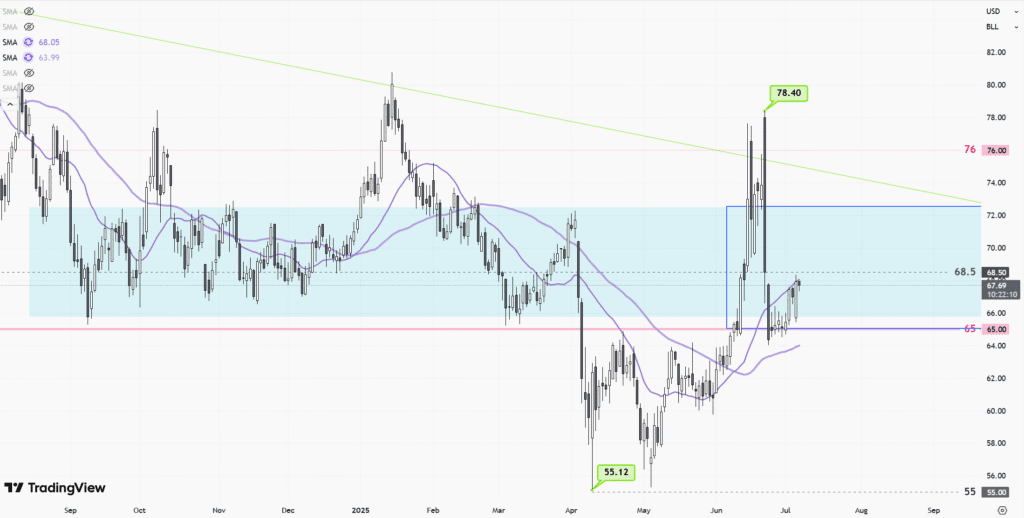
CLc1-Daily
https://int.1uptick.com/wp-content/uploads/2025/07/Commodities-CLc1-Daily-2025-07-15T120718.0390700.png” Market Overview Over the past week, CLc1 (WTI Crude Oil Futures) experienced notable volatility, with prices fluctuating from below $67 to around $68.50 per barrel. The market was driven by several key factors, including…
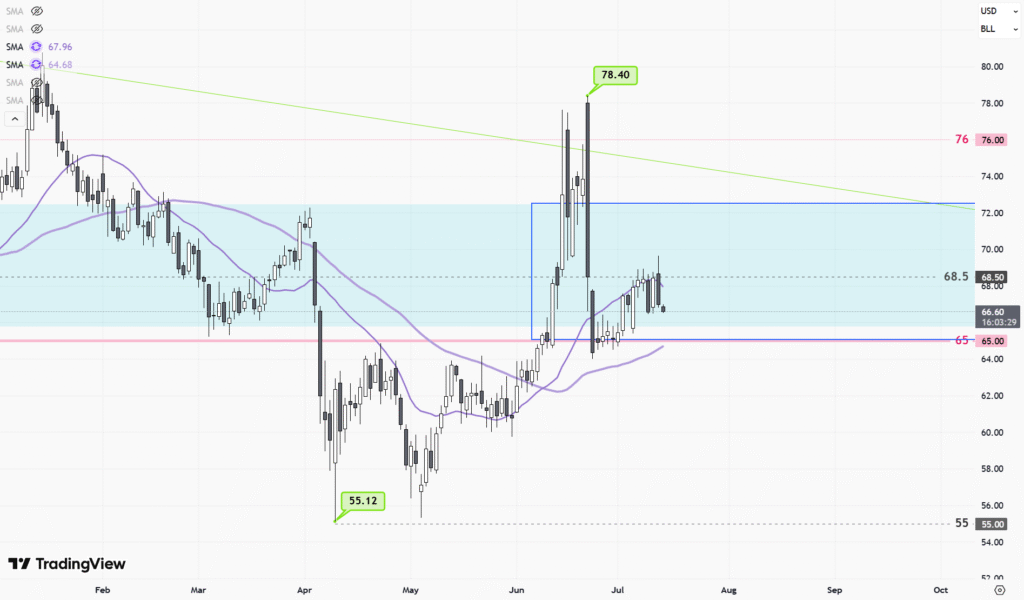
CLc1-Daily
<img class=”aligncenter wp-image-33036 size-large” src=”https://int.1uptick.com/wp-content/uploads/2025/07/Commodities-CLc1-Daily-2025-07-08T175039.9290700.png” Market Overview CLc1 (WTI crude oil futures) experienced modest price gains over the past week, trading in the range of $67.33 to $67.94 per barrel. The recent movement was influenced…
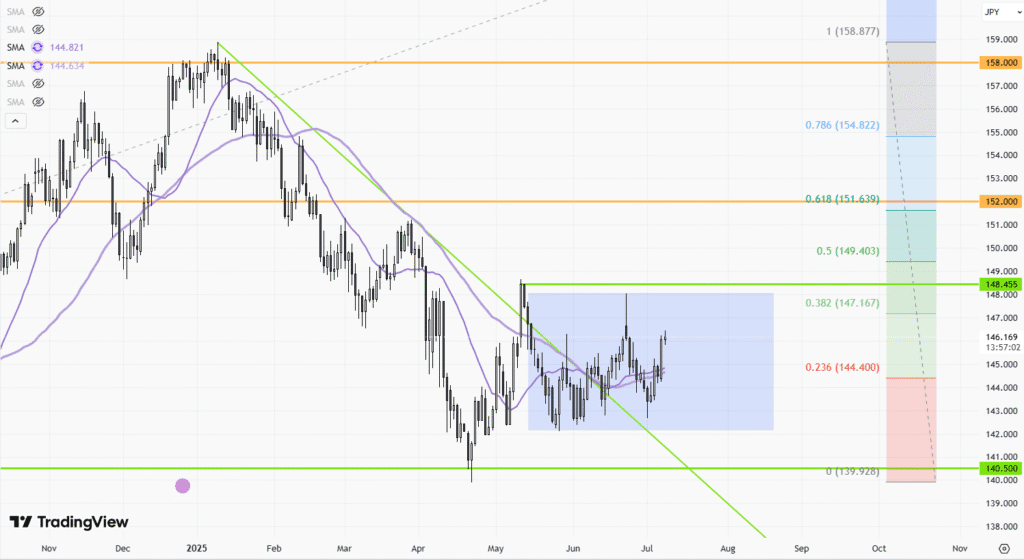
USDJPY-Daily
<img class=”aligncenter wp-image-33036 size-large” src=”https://int.1uptick.com/wp-content/uploads/2025/07/FX-USDJPY-Daily-2025-07-08T141633.6270700.png” Market Overview USDJPY traded in a volatile range between 142 and 148 over the past week, driven by several key factors. Strong U.S. employment data buoyed the dollar, easing fears…
![[Daily Closing 🔔] Gold – Gold Prices in New York Swing Sharply as Geopolitical Tensions and Dollar Strength Drive Market Uncertainty](https://int.1uptick.com/wp-content/uploads/2025/05/2025-05-22T235933.071Z-file-1024x576.png)
[Daily Closing 🔔] Gold – Gold Prices in New York Swing Sharply as Geopolitical Tensions and Dollar Strength Drive Market Uncertainty
Gold Prices See Sharp Swings on May 22 Amid Middle East Tensions and Dollar Rebound Gold prices in New York experienced significant volatility on May 22, with intraday swings exceeding $60. The sharp fluctuations were…
![[Daily Closing 🔔] Gold – Gold Prices Climb to New Highs on Tuesday as Weaker Dollar Boosts Safe-Haven Demand](https://int.1uptick.com/wp-content/uploads/2025/05/2025-05-22T004512.731Z-file-1024x576.png)
[Daily Closing 🔔] Gold – Gold Prices Climb to New Highs on Tuesday as Weaker Dollar Boosts Safe-Haven Demand
Gold Prices Climb for Third Straight Day, Break Above $3,300 Spot gold extended its rally for the third consecutive session, breaking above the $3,300 per ounce level to hit a one-week high. The weakened U.S.…
![[Daily Closing 🔔] Gold – Gold Prices Surge Nearly 2% to $3,287.60 as Weaker US Dollar Fuels Rally](https://int.1uptick.com/wp-content/uploads/2025/05/2025-05-20T224010.678Z-file-1024x576.png)
[Daily Closing 🔔] Gold – Gold Prices Surge Nearly 2% to $3,287.60 as Weaker US Dollar Fuels Rally
Spot gold surged on Tuesday, reaching a one-week high as the U.S. dollar weakened and safe-haven demand picked up. Prices broke through multiple technical resistance levels, settling at $3,287.60 per ounce—up nearly 2% on the…
[Daily Closing 🔔] Gold – U.S. Credit Rating Downgrade Triggers Gold Price Rebound – May 19 Market Recap
Spot gold prices have rebounded to $3,228.40 per ounce as a wave of safe-haven buying follows Moody’s downgrade of the U.S. credit rating and a weaker dollar. Investors are closely watching rising fiscal risks in…

Latest FX Analysis

Latest Gold Analysis