Technical Analysis
Evaluate price trends and patterns, identify potential investments and trading opportunities!
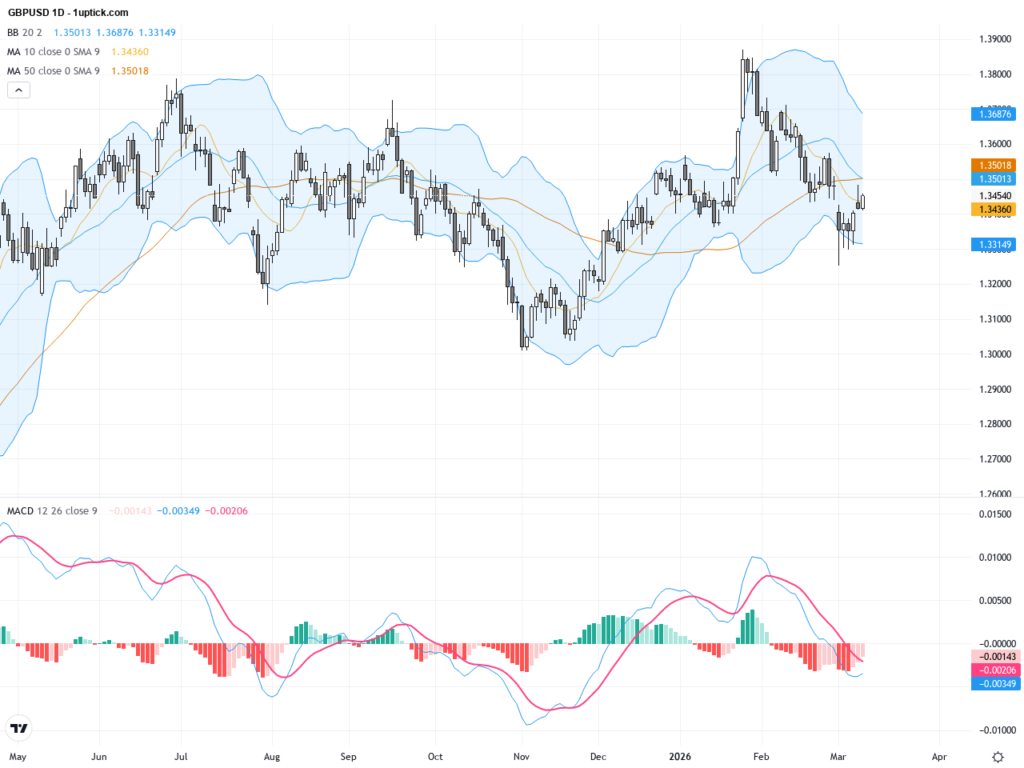
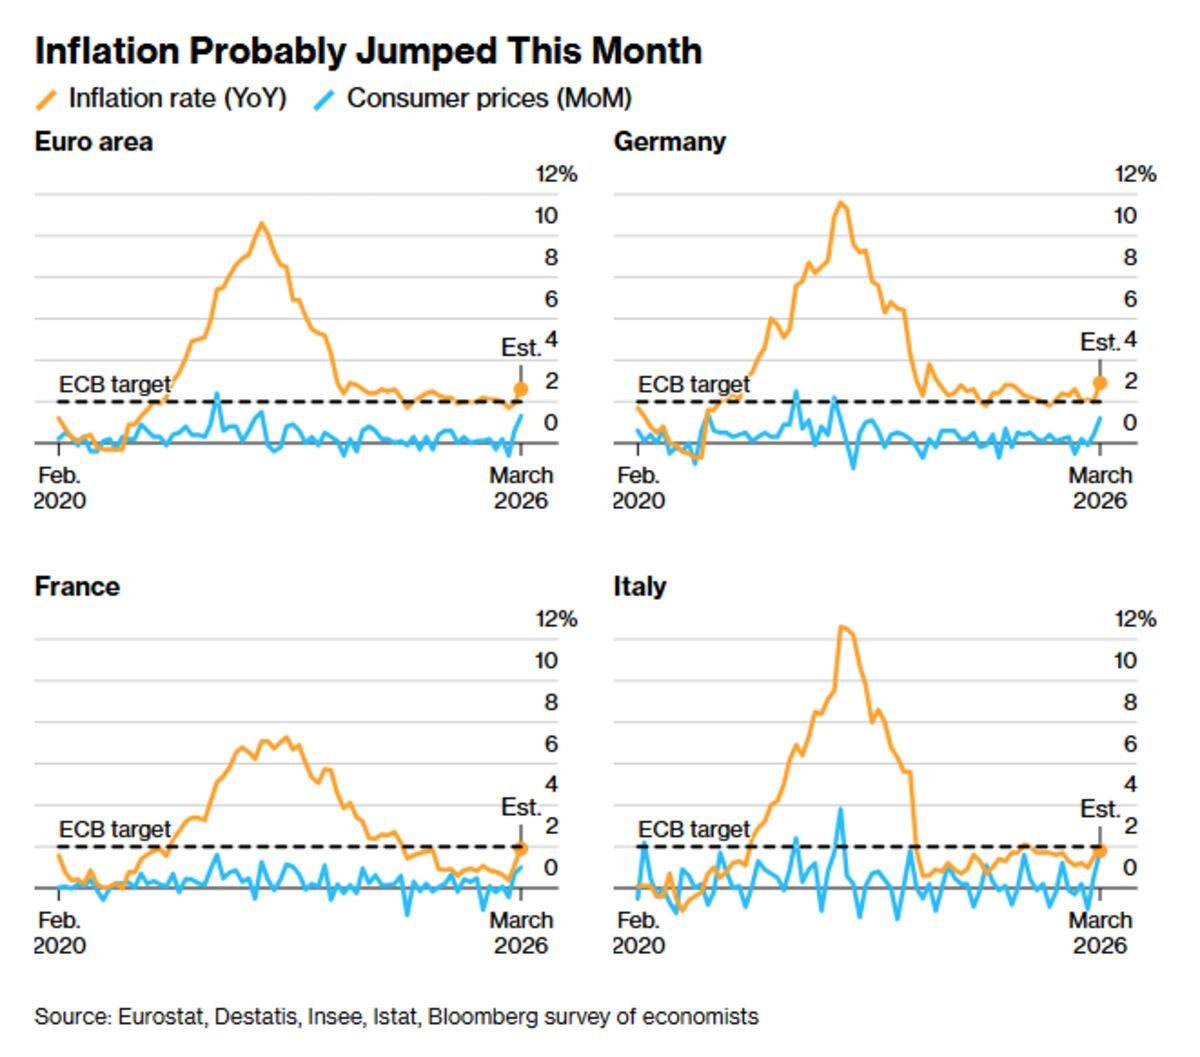
GBPUSD Technical & Fundamental Analysis: Key Resistance Holds Amid Bullish Consolidation
Over the past three trading days, GBPUSD has fluctuated around the 1.3400-1.3500 range, closing at 1.3454. The market mood was heavily influenced by Middle East geopolitical tensions and the US dollar’s strength fueled by inflation…
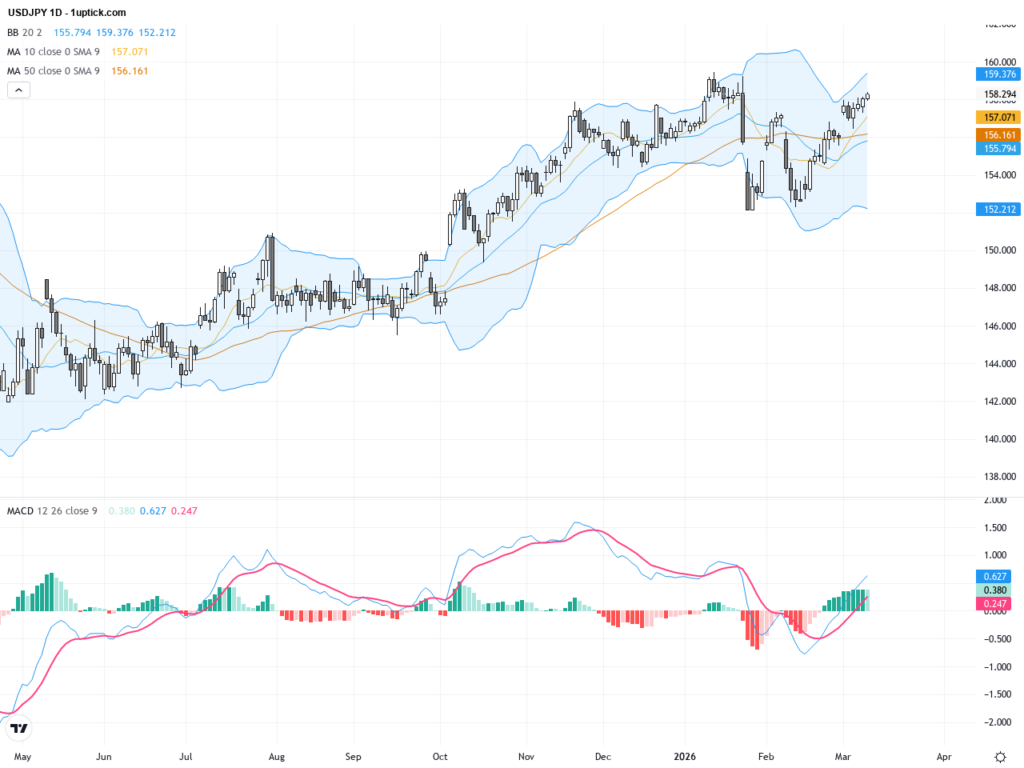
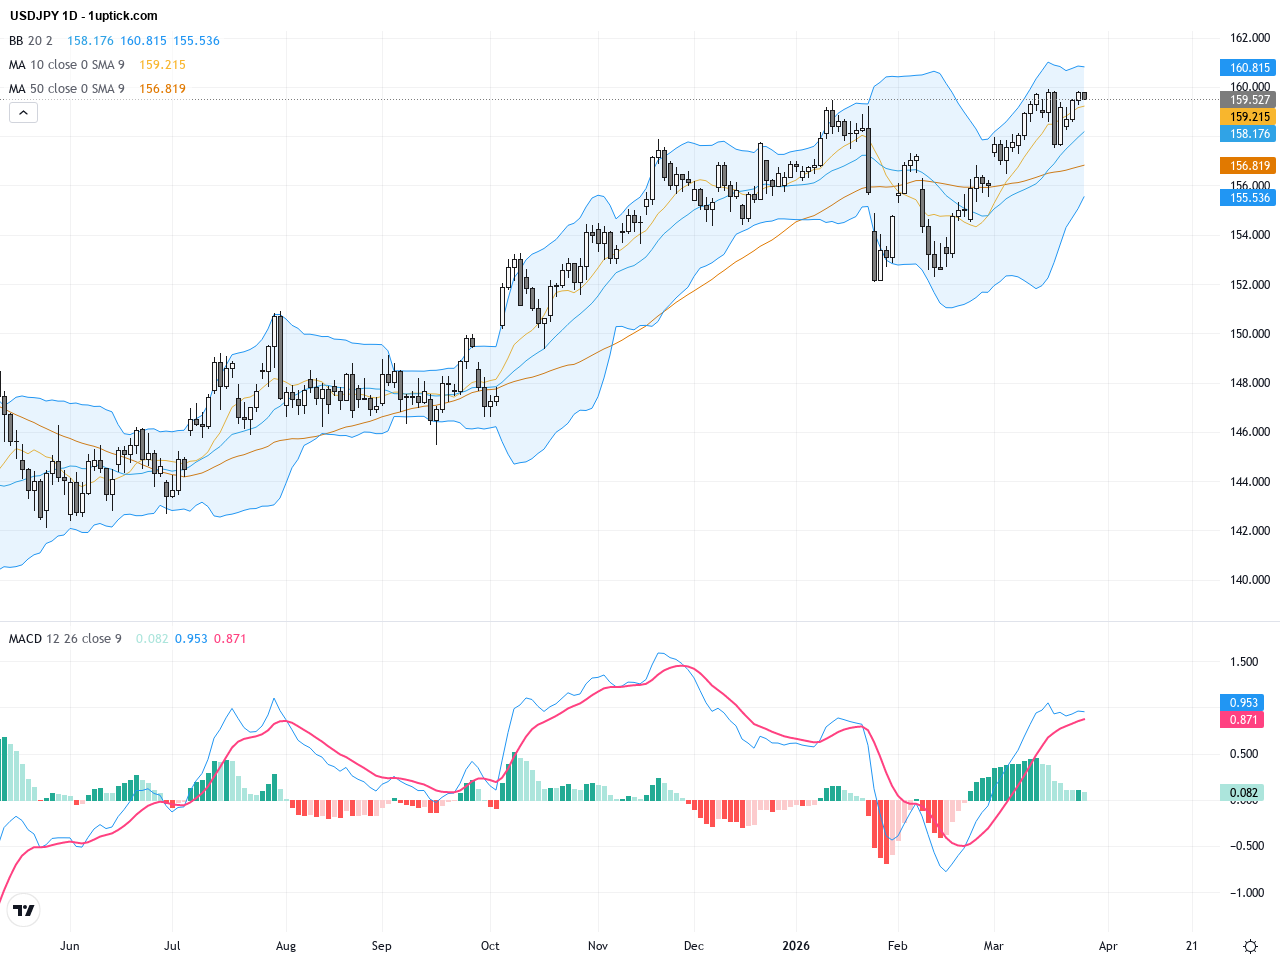
USDJPY: Key 158 Level Holds Amid Risk of Short-Term Technical Reversal
USDJPY has been consolidating around the 158 level amidst mixed influences from easing Middle East conflict and a weakening US dollar. Over the past three trading days, despite downward pressure on the dollar linked to…
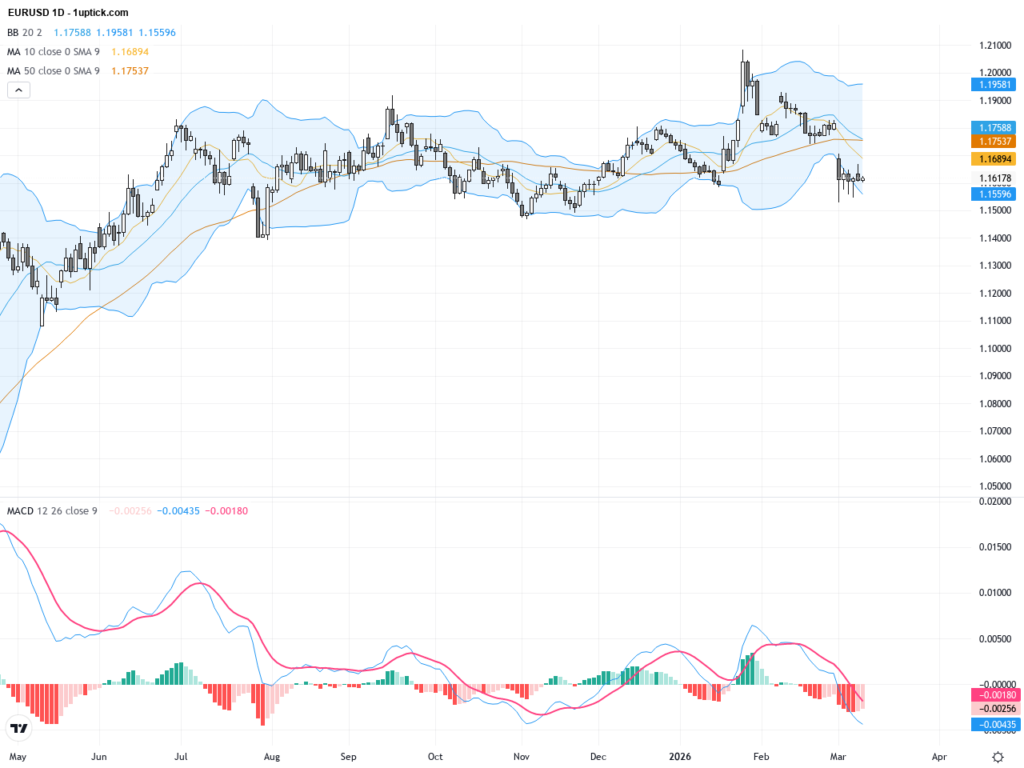
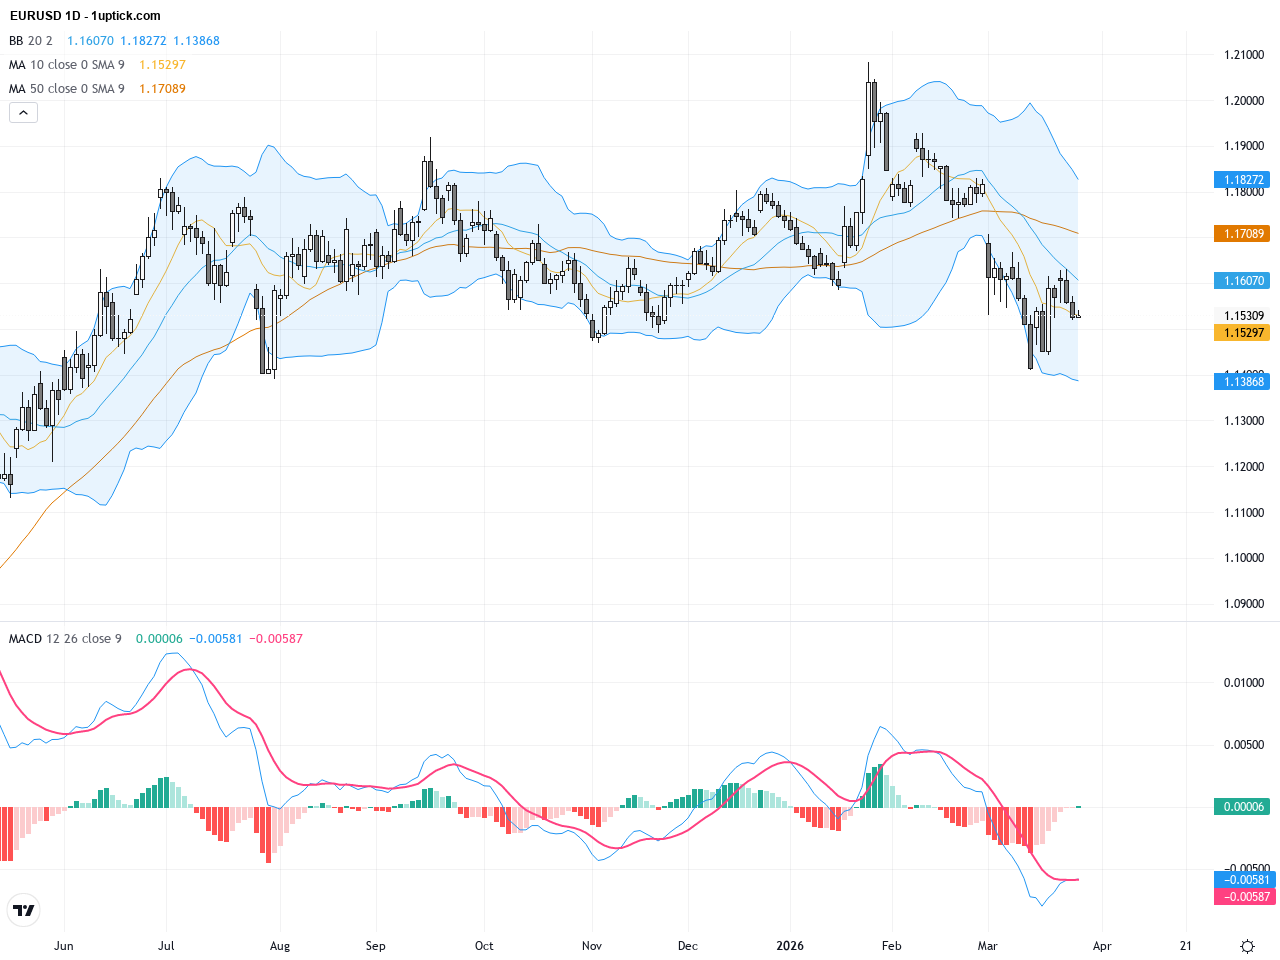
EURUSD Surges on Geopolitical Ease: Technical Patterns Signal Potential Rebound Momentum
EURUSD has experienced notable volatility over the past three trading days, rallying more than 150 pips as geopolitical tensions eased, with the price currently hovering around 1.18289. Despite the US dollar's strength supported by robust…

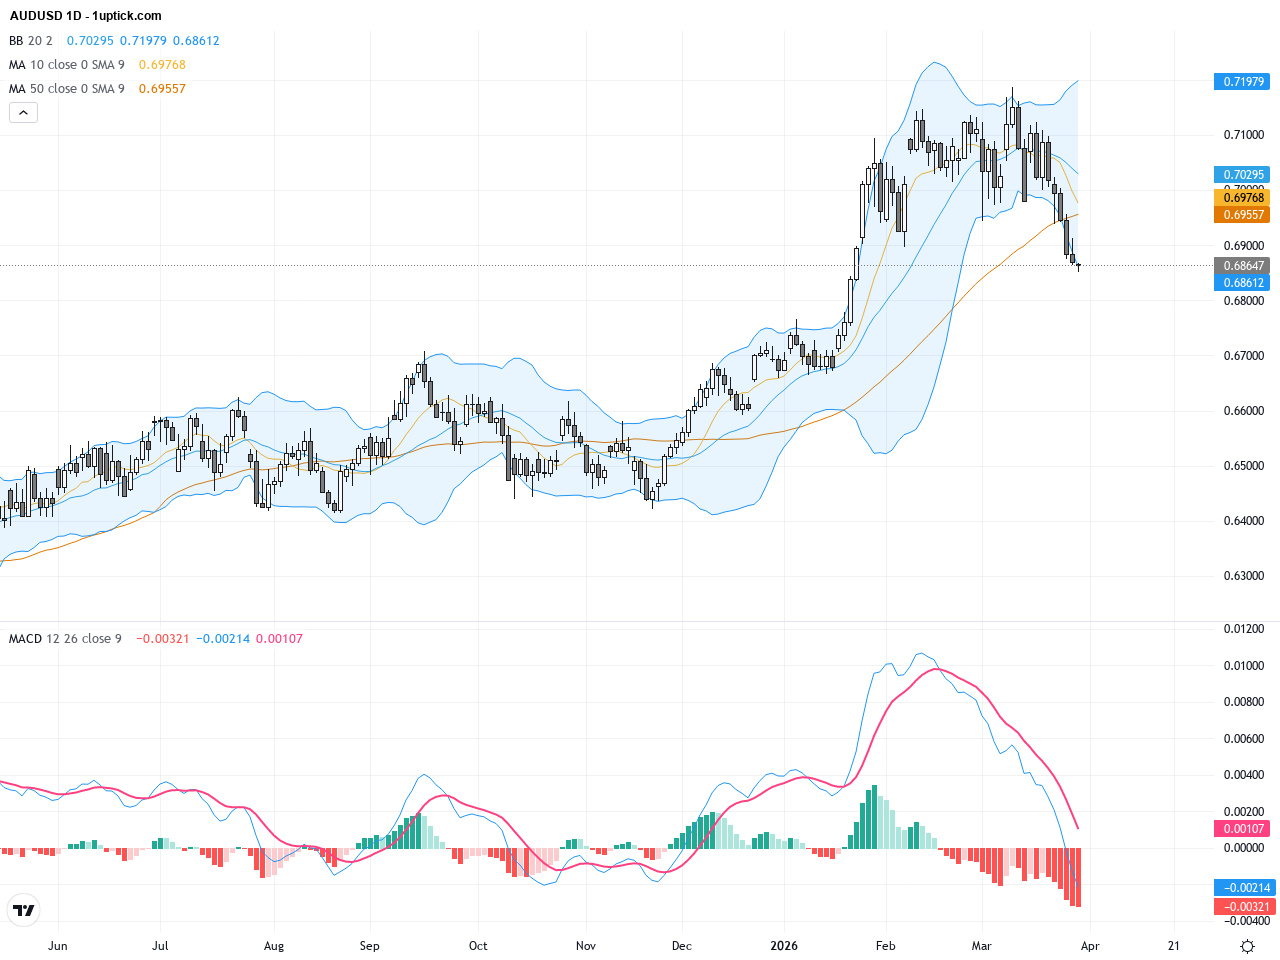
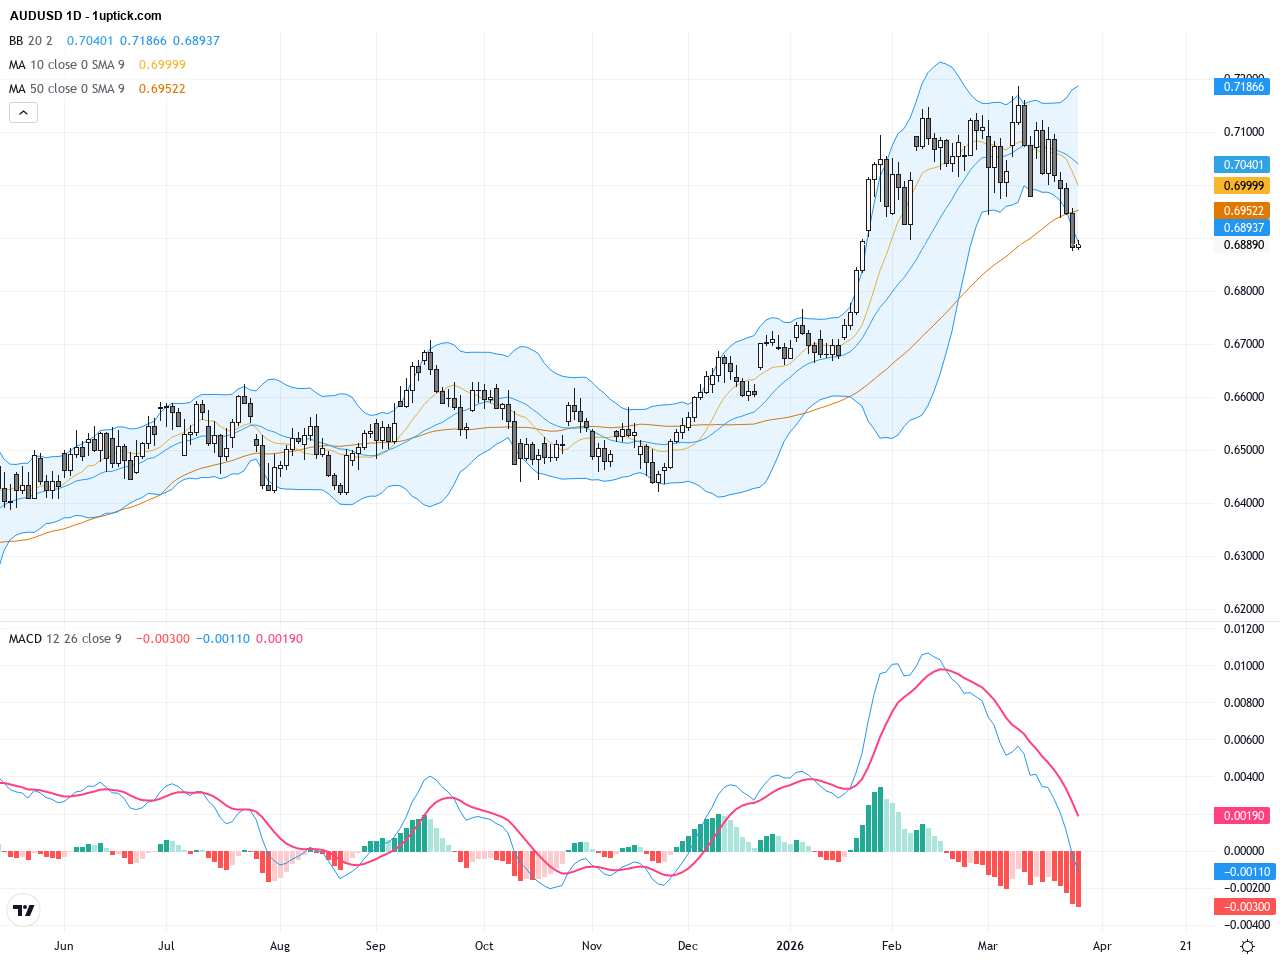
AUDUSD: Multi-Year High Breakout at 0.7168 Signals Strong Trading Outlook
Over the past three trading days, AUDUSD has displayed strong bullish momentum, breaking through the multi-year high of 0.7168 and closing yesterday at 0.71164. The market is heavily influenced by the hawkish stance of the…
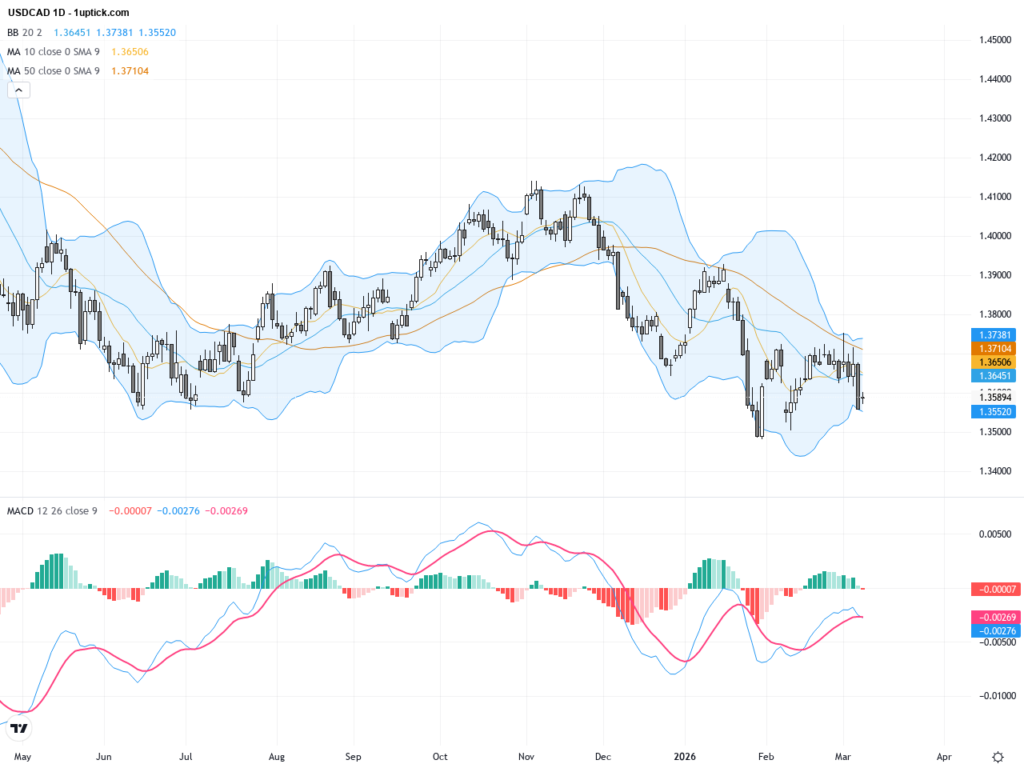
USDCAD: Oil Surge Pressures USD as Technical Patterns Signal Bearish Momentum
Over the past three trading days, USDCAD has experienced a steady decline from a recent high near 1.3660, closing yesterday at 1.35894. A sharp rise in oil prices above the $100 mark has strengthened the…
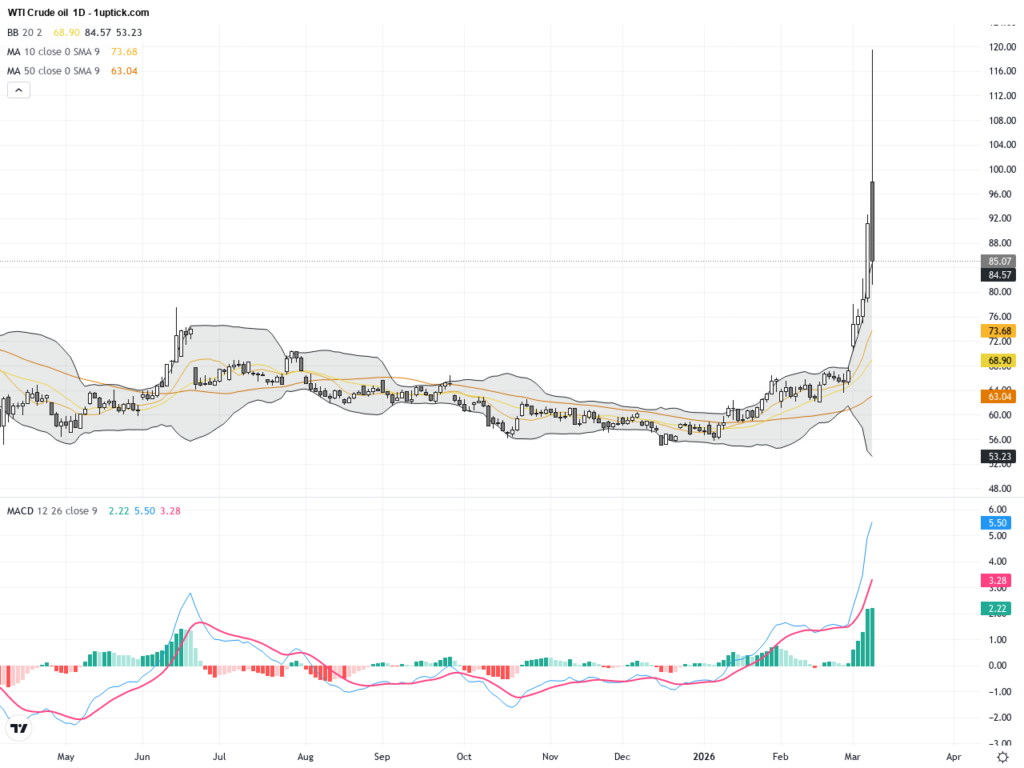
WTI Crude Oil: Sharp Pullback After Geopolitical Optimism Signals Key Support Levels Ahead
WTI Crude Oil has experienced significant volatility over the past three trading days. After surging to nearly $120 on March 8th, prices plunged to close at $85.08 on March 9th. This dramatic reversal was driven…
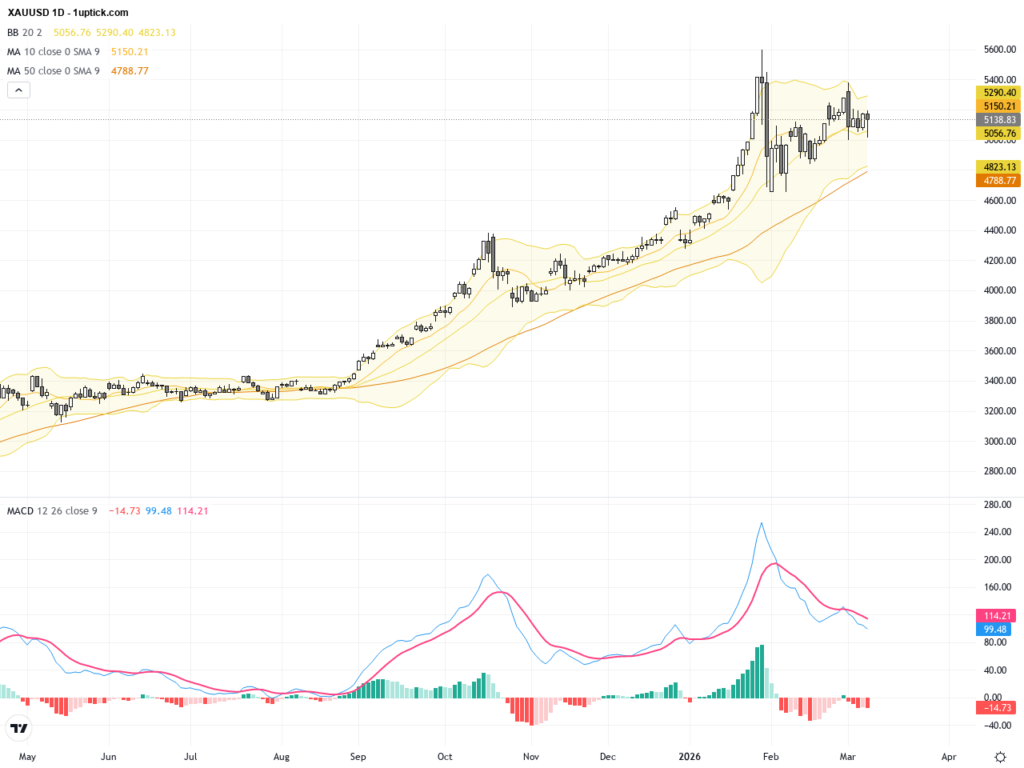
XAUUSD Gold: Key Support Testing Amid Technical Rebound and Trading Outlook
Over the past three trading days, XAUUSD displayed significant volatility, closing near 5137.91 yesterday with a clear pullback pattern. Gold’s price action has been influenced by multiple factors including oil prices hitting multi-year highs and…