Category: Technical Analysis
2024-12-28 @ 21:05
Price Movement The EUR/USD daily chart showcases a significant downtrend over recent months, with the pair forming lower highs and lows. After a sharp decline in late October, the price began to stabilize, finding support around the 1.0333 level. This support held multiple retests, indicating a temporary halt in the bearish momentum. Meanwhile, the pair […]
2024-12-28 @ 20:58
Price Movement The EUR/USD currency pair has experienced significant volatility recently. The pair was initially in a downward trend but appears to establish a base support around the 1.03330 level. The price action shows several tests of this support, indicating its strength. Despite previous bearish momentum, a minor bullish correction seems to be occurring as […]
2024-12-28 @ 20:57
Price Movement The gold daily chart reveals a significant bullish trend that persisted from May to early November, characterized by a steady rise with minor corrections. The price reached a peak around the 2,790 level, but this was followed by a sharp decline, indicating increased selling pressure. Subsequently, the price has been consolidating, finding support […]
2024-12-28 @ 19:13
Price Movement The WTI crude oil daily chart indicates a series of volatile price movements within a descending channel. The price has oscillated between the $65 support level and the $88 resistance level, reflecting a bearish trend over the past year. Recent price action shows consolidation within the $68 to $72 range, suggesting potential accumulation […]
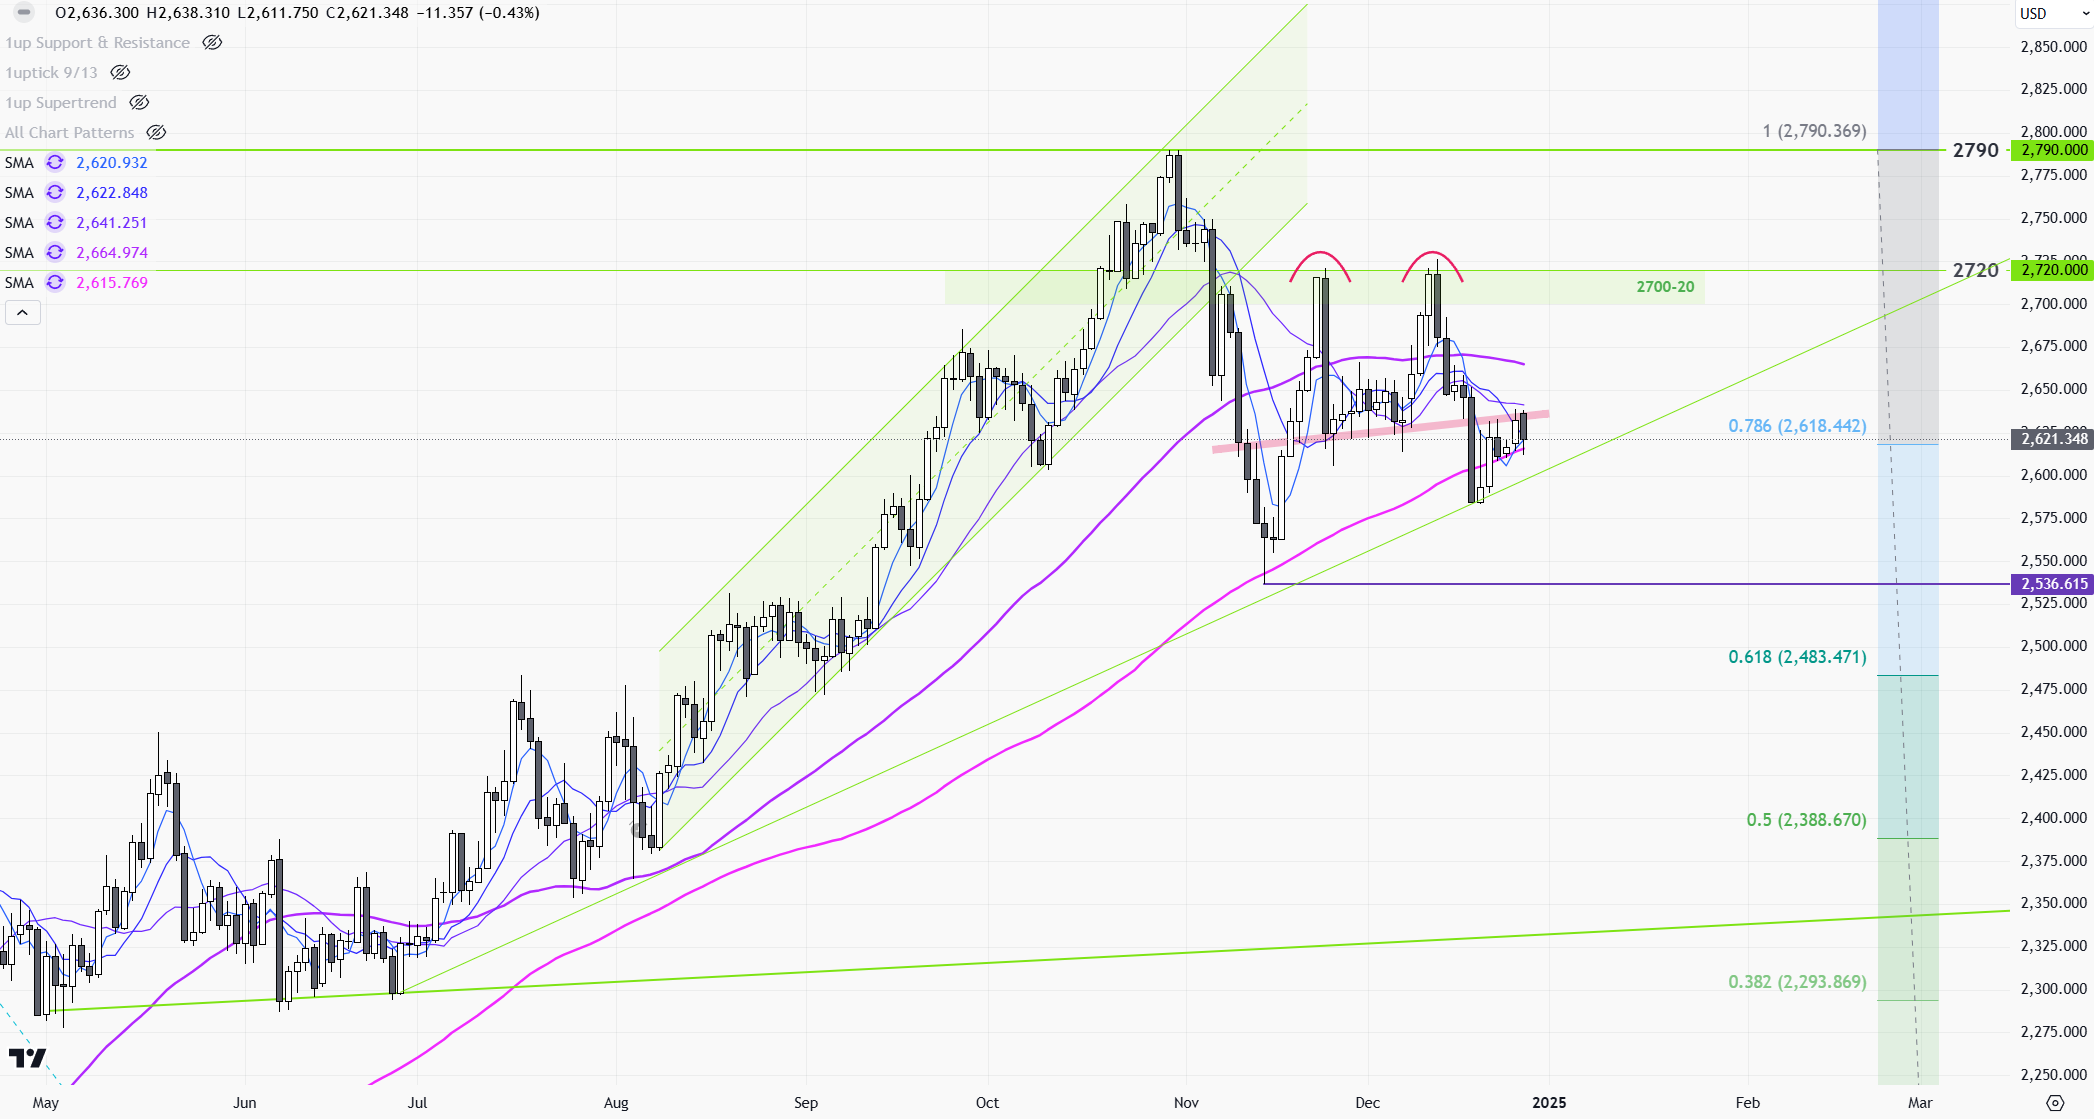
2024-12-23 @ 14:24
The downtrend in gold prices continued last week after turning back from the previous week’s high of 2726.The decline accelerated after the Fed’s interest rate meeting on Wednesday, failing to support at 2630(1) and falling back to a near three-month low near 2585.Then on Friday, US inflation data came down slightly, causing gold to bounce back above 2600 to close the week at 2622 (down $25 from the previous week).
As mentioned 2 weeks ago, there will be significant profit taking above 2700 while the year came close to the end. After the Fed’s meeting, the market fundamentals began to change again. Fed Chairman Powell indicated that the number of interest rate cuts will be reduced in 2025, from the previously expected 4 times to 2 times; next year’s relatively high inflation and high-interest rate environment will bring support to the US dollar while keeping gold prices under pressure. The new U.S. President’s tariff policy will be the dominate factor to lead the gold price next year.
>
1-Hour Chart (Above) > Gold price rebounded after hitting 2583 late last week, forming a S-T bottom. Expect the rebound top near 2650. The market should be relatively quiet this week, take 2580-2650 as the trading range for now until the market develop further this week.
>
Daily Chart (Above) > Gold was rejected by 2700 twice on the daily chart, forming a double top pattern (3). Short selling should control the market as it cleared the support by the double top neckline (3.1) last week. After the current S-T rebound, the downtrend should resume and expected the price to return to around 2540-50 in the next 2 weeks. M-T operating range would be 2535-2730(4).
P. To
Despite the initial drop on Monday, the gold price was relatively quiet last week.
The price shot up to around 2710 due to all the geopolitical tensions the week before. But then, it quickly retreated after an uneventful weekend. The risk premium dramatically reduced as the Asian market opened on Monday, leading to gold prices falling below 2700 early in the session. During the U.S. trading session on the same day, Trump announced the preliminary tariff policies on China, Canada, and Mexico via social media. The market anticipated a continued high-interest environment in the U.S. until 2025, exerting pressure on gold prices once more, causing them to dip below 2650(1). Gold prices stabilized thereafter, with a holiday atmosphere prevailing, prices rebounded throughout the week, closing near 2650.
Gold prices experienced significant fluctuations in the past couple of weeks due to the Russia/Ukraine and Israel/Palestine situations. However, as tensions ease, the upward momentum for price has waned. Heading into the final month of 2024, the gold market continues to be influenced by profit-taking sentiments, as the number of open interests in COMEX gold futures dropped, from 560,000 in early November to 450,000 last Friday. Unless there are significant changes in the fundamentals, gold prices are expected to keep consolidating.
This week, the focus will be on Friday’s US employment data, with market expectations suggesting a rebound in non-farm payrolls to 200,000. Gold prices are likely to face some pressure before the data is released.
>
1-hr chart(above) > Early in the Asian session today, the S-T trend turned bearish as the gold prices dipped below the support line(2). Strong selling resistance appeared near 2665 at the end of last week, suggesting initial operations within the 2600-2665(3) range. If this week’s US job data performs well in the latter part of the week, the gold price may once again visit below 2600.
>
Daily chart(above) > The overall trend for gold prices continues to adjust towards the 2600 mark, as mentioned last week. The significant selling pressure on Monday (4) is expected to continue influencing the S-T direction. The daily chart range is set between 2605-2665, and if there’s a downward breakout later this week, the downside target could be set around the 100-day MA near 2574 (6).
P. To
2024-11-25 @ 16:48
Technical rebound + Russia/Ukraine situation rapidly deteriorated, causing gold prices to rebound strongly over $150 last week.
Following the rebound from the week before, the gold price opened at 2562 and quickly reached our target of 2620 early last week. Russia and Ukraine exchanged missiles and Putin eased the conditions for the use of nuclear weapons, boosting the gold price further. By the end of the week, the gold price reached the weekly high of 2715 as the market priced in the risk premium right before the weekend.
The gold price retreated sharply back from the weekend, falling to as low as 2658 in the Asian secession on Monday. We can expect the investment market to be relatively quiet this week as Thanksgiving weekend is approaching. Geopolitical situations will continue to dominate the gold trend this week. Since the gold price has surged over 20% from the beginning of the year, as long as the situation in Ukraine does not intensify, the price above 2,700 should be a good opportunity for institutional funds to seize profits from the beginning of the year before the year’s end.
>
1-hr chart (above) > Gold price has entered a horizontal range pattern after it crossed the downward trend resistance line (1) last week. Take advantage of the 2650-2710(2) for now, and pay close attention to the development of the situation in Russia/Ukraine, the market may price in the risk premium once again before the Thanksgiving long weekend!
>
Daily chart (above) > The rapid correction in the Asian session on Monday is causing a reversal signal to appear on the daily chart(3). Wait for the price to close below 2670 on Monday, once the reversal signal is completed, the price should return to 2600 or lower in the next two weeks.
P. To
2024-11-18 @ 17:01
The market last week unfolded in line with our predictions, as the consolidation period continued. The price broke below the 2650(1) resistance level early in the week, initiating a downward movement toward our target at 2600. Subsequently, the price dropped to the weekly low of 2536 following the inflation data on Wednesday. A slight rebound occurred afterward, with the week closing near 2562 on Friday, marking a $102 decline.
Following the US election, the US dollar has remained strong, leading to a drop of over $250 in gold prices over the past two weeks. Nevertheless, the selling pressure has eased after the rebound from 2538. It’s worth noting that Fed Chairman Powell explicitly mentioned last Thursday that there is no rush to cut rates at the current market conditions, limiting the upward potential for gold for the time being. With no significant market data on the calendar for this week, gold prices are expected to stay sideways.
>
1-hr chart(above) > The downward momentum has been decelerating since last Thursday. If the price manages to break out from the current descending trendline (3), we can establish the initial upside target at 2620 (4). Given the absence of significant economic data scheduled for this week, we can regard the range of 2555-2620 (4) as the provisional operating zone.
>
Daily chart(above) >Gold achieved a 50% retracement last week (5) and rebounded from the 100-day MA (6). We can anticipate resistance in the short term around 2600-2605(7). In case of a breach above 2600, the subsequent target is expected near the 10-day moving average of around 2630.
P. To
2024-11-11 @ 18:15
Gold prices fell back from their highs last week, in line with our expectations. The U.S. election suppressed the market in the early period, and gold prices were under pressure in the 2750-58(1) resistance zone. Once the election results became clear, the decline began to accelerate. A few US media announced Trump’s victory prior to the official result, causing the first drop to the low of 2701. A few hours later, when the election results were officially announced, the price of gold went straight through 2,700 and fell all the way to the week’s low of 2,643. Subsequently, at the US Fed meeting, the committee cut the rates by 1/4% in line with market expectations. Gold prices took advantage of the momentum to rebound to 2710, closing the market at 2684 before the weekend.
After last week’s sharp drop, gold’s upward momentum has officially weakened. The price of gold has soared by nearly $800 since the beginning of the year, so we should start to beware of relatively large-scale institutional liquidation activities as the year-end approaches. The focus this week is Wednesday’s U.S. inflation data. If the CPI data does not slow down like the PCE inflation number released 2 weeks back, gold prices will likely retest the low again this week.
>
1-hour chart (above) > Since gold price escaped the sideway range (4) last week, the decline has speeded up, and the downward resistance has accelerated from (2) to (2.1). The S-T trend remains bearish, with the 1st target set at last week’s low of 2646 -50(3). If gold prices fall beyond 2646, the next downside target will be near 2600. On the other hand, we must still pay attention to the fact that if the gold price surges above the falling resistance line (2.1) in the next 48 hours, the gold price may stay within 2650-2710(4) for a while longer until the next major move.
>
Daily chart (above) > Gold prices broke out from the M-T uptrend channel (5) originating from August, and the upward trend in the past three months has officially ended now. The price is currently supported by the 50-day MA (7). Before the price adjusts further down, the pattern on the daily chart will remain sideway between 2645-2710 (8).
P. To
2024-11-04 @ 17:10
Driven mainly by the US election and economic figures last week, the gold price pulled back from the newly formed record high. With the US election approaching, the gold market opened strong early last week. A better-than-expected US consumer confidence on Tue. led to a breakthrough of the previous high at 2758 (1), triggering a new round of S-T buying until it reached 2790 and the US 3Q GDP and ADP employment on Wed. However, the upward momentum reversed on Thursday after the core PCE inflation data, setting off a round of short-selling and profit-taking pushing gold prices back below the 2750-2758 resistance zone(3). Friday’s US employment data fell significantly below expectations, but the gold price still failed to close above 2758(3), the week ended at 2735.
Gold prices retreated from 2790 with significant profit-taking action reflected in the number of COMEX gold open interest on Oct. 31st. The profit-taking activities should persist early this week ahead of two major events (the US election and the Federal Reserve interest rate meeting). Unless there is a strong market reaction with a Trump victory or additional aggressive rate cuts from the US Fed. sparking a new round of S-T buying, it is unlikely that gold prices will reach over 2790 this week.
>
1-hr chart (above) > Gold price broke the support line (2) last week, indicating a slowdown of the upward momentum. The selling pressure was relatively strong above 2758(3) as the price failed to clear the resistance zone(3) after the extremely weak US employment figures last Friday. Before the result of the US election and the US Fed., the S-T trading range is now set at 2710-2750 (4).
>
Daily Chart (above) > The Gold price was rejected by the upper resistance of the uptrend channel (5) last week, followed by a single-day drop of over $40 last Thursday, an S-T reversal signal has appeared on the daily chart. Investors are waiting for the news to impact the market from the US election and the US Fed. meeting, the S-T trend should remain bearish for now. The first target on the daily chart is at 2715 (6) and the 20-day moving average (7).
P. To