Category: Technical Analysis

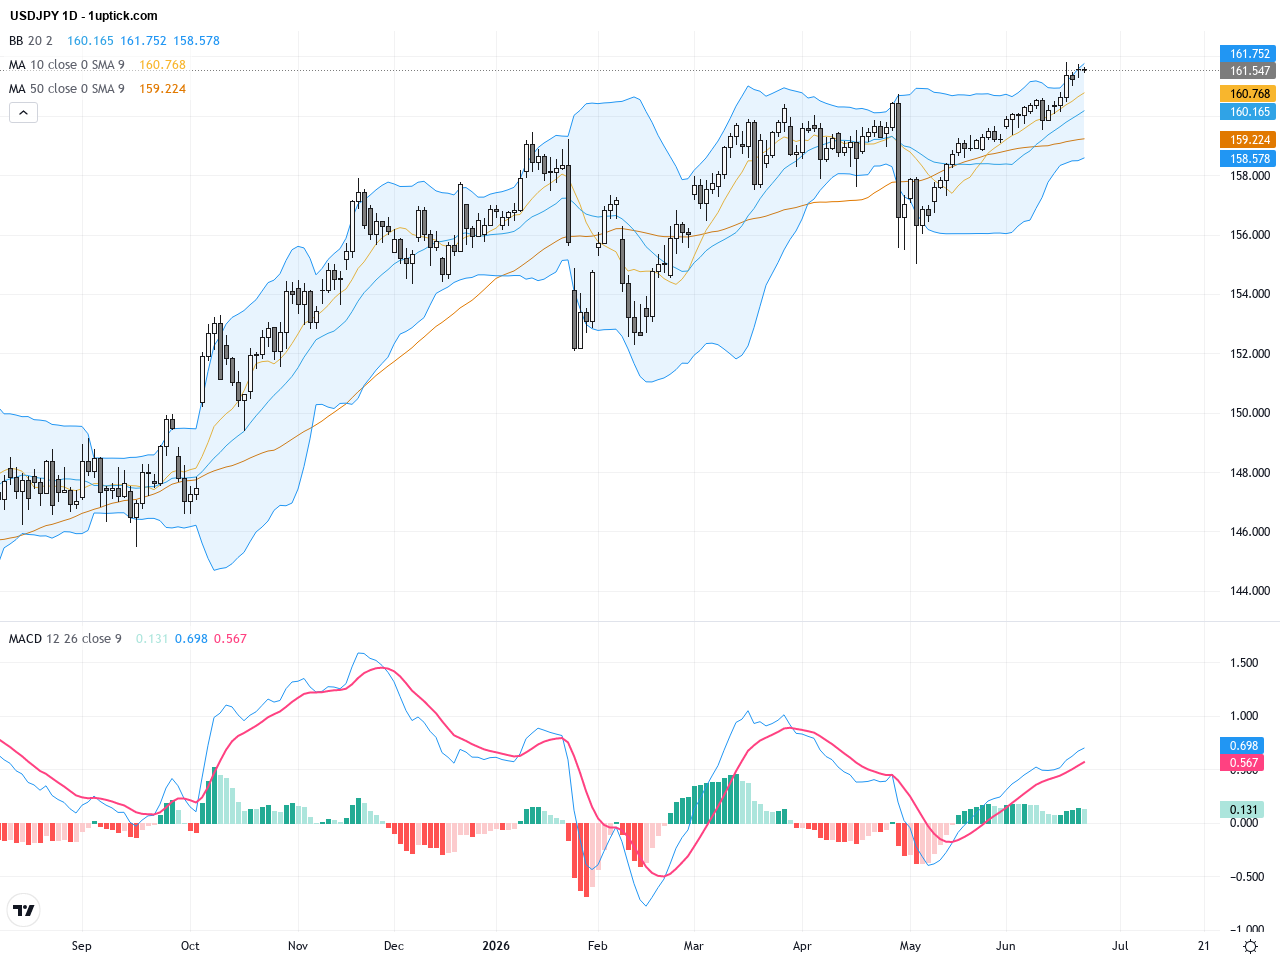
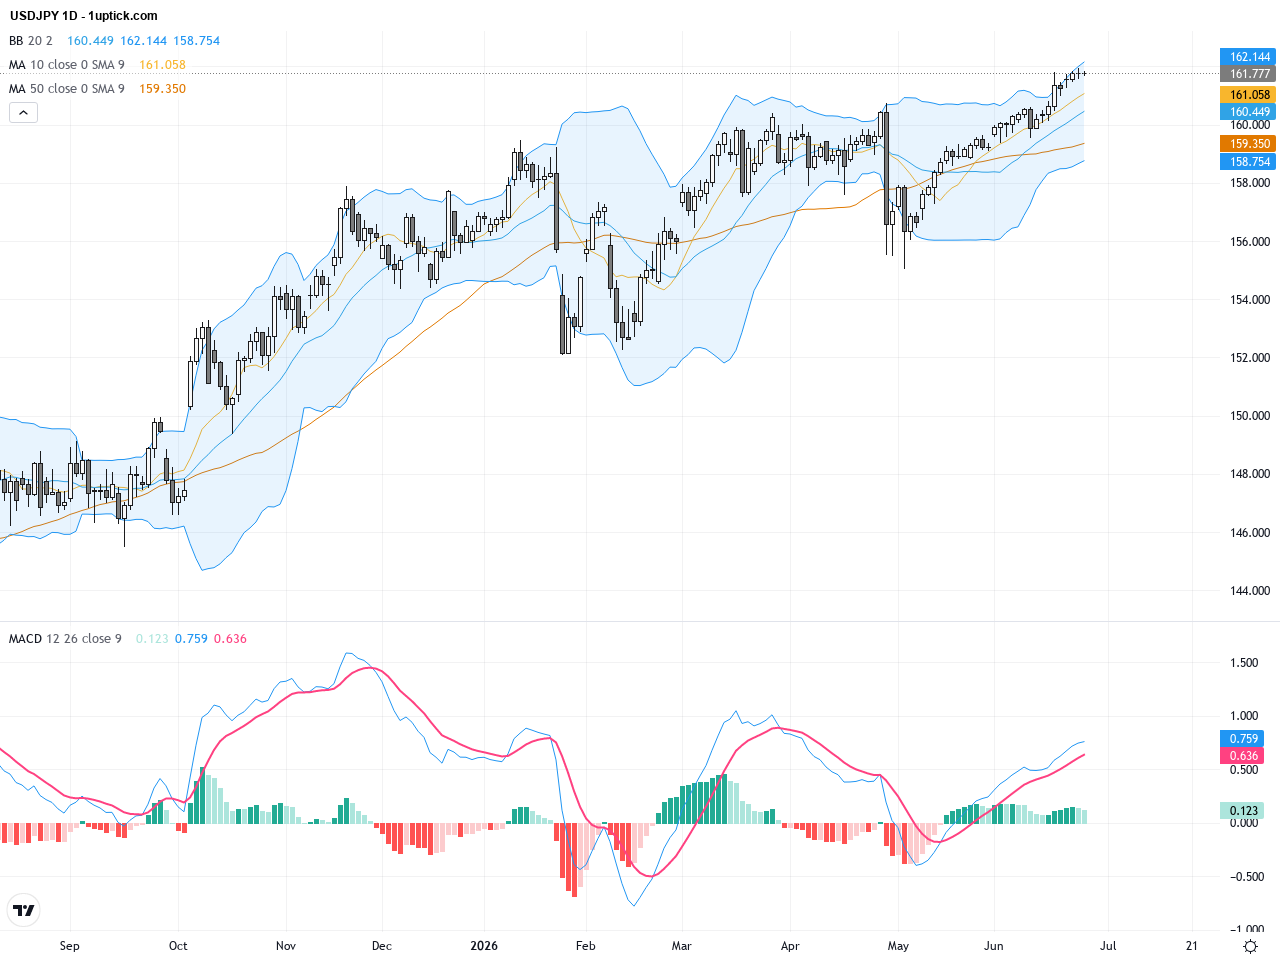
USDJPY Technical and Fundamental Analysis: Approaching Two-Year High Amid Intervention Risks, June 26, 2026

Over the past three trading days, USDJPY experienced notable volatility, closing near 161.77 yesterday, close to a two-year high. The market was driven by declining US 10-year yields and a weakening yen, pushing the dollar higher against the yen. Japan’s $2.3 trillion investment plan raised concerns over rising JGB yields, increasing market uncertainties. Meanwhile, expectations of a hawkish Federal Reserve keep USD demand robust but also raise intervention fears by the Bank of Japan. For retail investors, recent price action reflects strong USD fundamentals combined with geopolitical tension, making it crucial to monitor critical support and resistance levels alongside news on possible currency interventions.

EURUSD: Critical Support Break Sparks Bearish Momentum with Trading Outlook, June 26, 2026

Over the past three trading days, EURUSD fluctuated between 1.132 and 1.138, closing yesterday at 1.13648, slightly below the previous day. Recent market news highlights sticky U.S. PCE inflation for May and accelerating consumer spending. Despite persistent U.S. inflation pressure, the USD has softened, giving the Euro a mild lift. However, dovish ECB commentary and weak Eurozone PMI data weigh on the Euro, pushing EURUSD lower and breaking key support levels. For average investors, this reflects increased volatility driven by policy divergence and economic data contrasts between the Euro and dollar. Caution is advised in the near term as the pair may either see a technical rebound or further decline.

AUDUSD: Approaching 200-Day EMA as Key Support Amid Mixed Economic Data, June 26, 2026

Over the past three trading days, AUDUSD has retreated from around 0.695 to close near 0.69068 yesterday, closely testing the 200-day moving average at approximately 0.69133. This decline was driven by mixed Australian CPI data and strong US PCE inflation prints that bolstered the US dollar, pushing AUDUSD down to an 11-week low. The market mood shifted towards risk aversion, weighing heavily on the Aussie dollar. For investors, this implies a short-term jittery environment fueled by global uncertainty and robust USD demand, underscoring the need to monitor critical technical and fundamental factors.

XAUUSD Technical & Fundamental Report: Triangle Consolidation Signals Short-Term Adjustment, June 26, 2026

Over the past three trading days, XAUUSD has consolidated around the $4025 level, with yesterday’s close at $4024.92 showing a slight rebound. Market news indicates slim chances of gold surpassing $4200 this month, with Deutsche Bank sharply cutting price forecasts and a general tilt towards caution. Easing geopolitical risks have reduced gold’s safe-haven appeal. For average investors, this suggests gold is currently in a profit-taking consolidation phase, and short-term trading should focus on established support and resistance levels. The upcoming week’s gold price will be heavily influenced by the US dollar’s strength and key US economic data releases, requiring close monitoring of market news and technical patterns.

USDCAD: Breaking 14-Month High Amid Mixed Dollar-Canadian Dollar Market Signals, June 25, 2026

USDCAD has shown notable volatility over the last three trading days, reaching a 14-month high of 1.42478 on Wednesday and closing at 1.42302 yesterday. Despite the Federal Reserve maintaining a hawkish stance, the US dollar has weakened recently, allowing the Canadian dollar to gain slight traction. The interest rate differential between the US and Canada remains a key driver, sustaining the pair’s elevated price levels. For average investors, the scenario reflects a tug-of-war between continued US yield advantages and the potential for a near-term reversal. Traders should watch for key technical support and resistance, as well as upcoming economic data, to gauge future direction.

WTI Crude Oil: Price Drops Below $70 Amid Iran Deal Optimism and Strait of Hormuz Stability, June 25, 2026

WTI Crude Oil has experienced a significant decline over the past three trading days, plunging from $74.82 on June 22 to $69.87 on June 24 amid heightened volatility. Recent news highlights that optimism over a U.S.-Iran deal has significantly reduced the geopolitical risk premium, pressuring oil prices downward. Additionally, China’s crude imports have dropped to their lowest since 2018, further affecting supply and demand dynamics. For investors, this rapid price movement feels like navigating a volatile battlefield influenced by shifting geopolitical and market fundamentals. Staying informed on market news and technical patterns is essential for making smart trading decisions on WTI.

XAUUSD: Key Resistance and Support Levels Amid Multi-Month Low Test in Gold Trading Outlook, June 25, 2026

Over the past three trading days, XAUUSD (Gold) declined sharply from highs near 4191 to a close of 3997 yesterday, reflecting strong selling pressure and elevated volatility. The gold market faces multiple bearish headwinds, including Deutsche Bank’s aggressive 22% forecast cut and waning bullish sentiment on Wall Street. Despite a brief rebound amid easing geopolitical tensions, the price action remains weak. For investors, this signals significant short-term uncertainty and risk, highlighting the importance of monitoring key support and resistance levels to avoid chasing rallies and adopt cautious trading strategies.

GBPUSD: Key Support Test Amid Political Uncertainty Weighs on Pound, June 24, 2026

Over the past three trading days, GBPUSD has exhibited a declining trend with volatility, closing yesterday at 1.31933 near this year’s lows. The market mood has been influenced by UK political uncertainty and strong US manufacturing PMI data, pressuring the Pound while the US Dollar strengthens on safe-haven demand. The recent Bank of Japan statements had a limited impact on GBPUSD, as UK-specific factors dominate price action. For average investors, the continuing UK political turmoil signals further downside risk for GBPUSD in the short term. Overall, the pair is consolidating and searching for a directional cue, with market participants advised to watch closely for upcoming US and UK economic data releases and any political developments.

USDJPY: Rising Intervention Risks as Pair Nears 162 Resistance Amid Technical Strength, June 24, 2026

Over the past three trading days, USDJPY has steadily climbed, closing yesterday at 161.547 near its highest levels in nearly 40 years. Following talks between Japanese Finance officials Katayama and Bessent, the prospect of currency intervention has heightened market attention. The US dollar strengthens amid weak stock markets boosting liquidity demand, while the Japanese yen remains under pressure amid intervention speculation. For everyday investors, the near-record yen weakness implies rising risks and potential impacts on import costs and forex strategies. Overall, USDJPY’s trading outlook reflects a balance between technical strength and policy uncertainty, suggesting cautious approach in the short term.

EURUSD Analysis: Euro Falls Below 1.1400 as Technical Patterns Signal Volatility, June 24, 2026

Over the past three trading days, EURUSD has continued to decline, breaking the critical 1.14 support level and closing yesterday at 1.13764. The Euro weakened amid dovish comments from ECB’s Lagarde and soft PMI data, while the US Dollar gained strength on hawkish Federal Reserve expectations. Market sentiment was influenced by a tech sell-off and declining US Treasury yields, resulting in a cautious risk appetite. For average investors, this means increased volatility in the EURUSD pair with uncertainty ahead, making it essential to track upcoming European economic releases and Fed moves closely.

1uptick Analytics @

Risk Warning​

*Investment involves risk. You may use the information, strategies and trading signals on this website for academic and reference purposes at your own discretion. 1uptick cannot and does not guarantee that any current or future buy or sell comments and messages posted on this website/app will be profitable. Past performance is not necessarily indicative of future performance. It is impossible for 1uptick to make such guarantees and users should not make such assumptions. Readers should seek independent professional advice before executing a transaction. 1uptick will not solicit any subscribers or visitors to execute any transactions, and you are responsible for all executed transactions.

© 2022-26 1uptick Analytics all rights reserved.


Risk Warning​

*Investment involves risk. You may use the information, strategies and trading signals on this website for academic and reference purposes at your own discretion. 1uptick cannot and does not guarantee that any current or future buy or sell comments and messages posted on this website/app will be profitable. Past performance is not necessarily indicative of future performance. It is impossible for 1uptick to make such guarantees and users should not make such assumptions. Readers should seek independent professional advice before executing a transaction. 1uptick will not solicit any subscribers or visitors to execute any transactions, and you are responsible for all executed transactions.

© 1uptick Analytics all rights reserved.

Home
.AI
Analysis
Calendar
Tools