Tag: Gold

Gold Trend 10/3 – Key support @ 2880

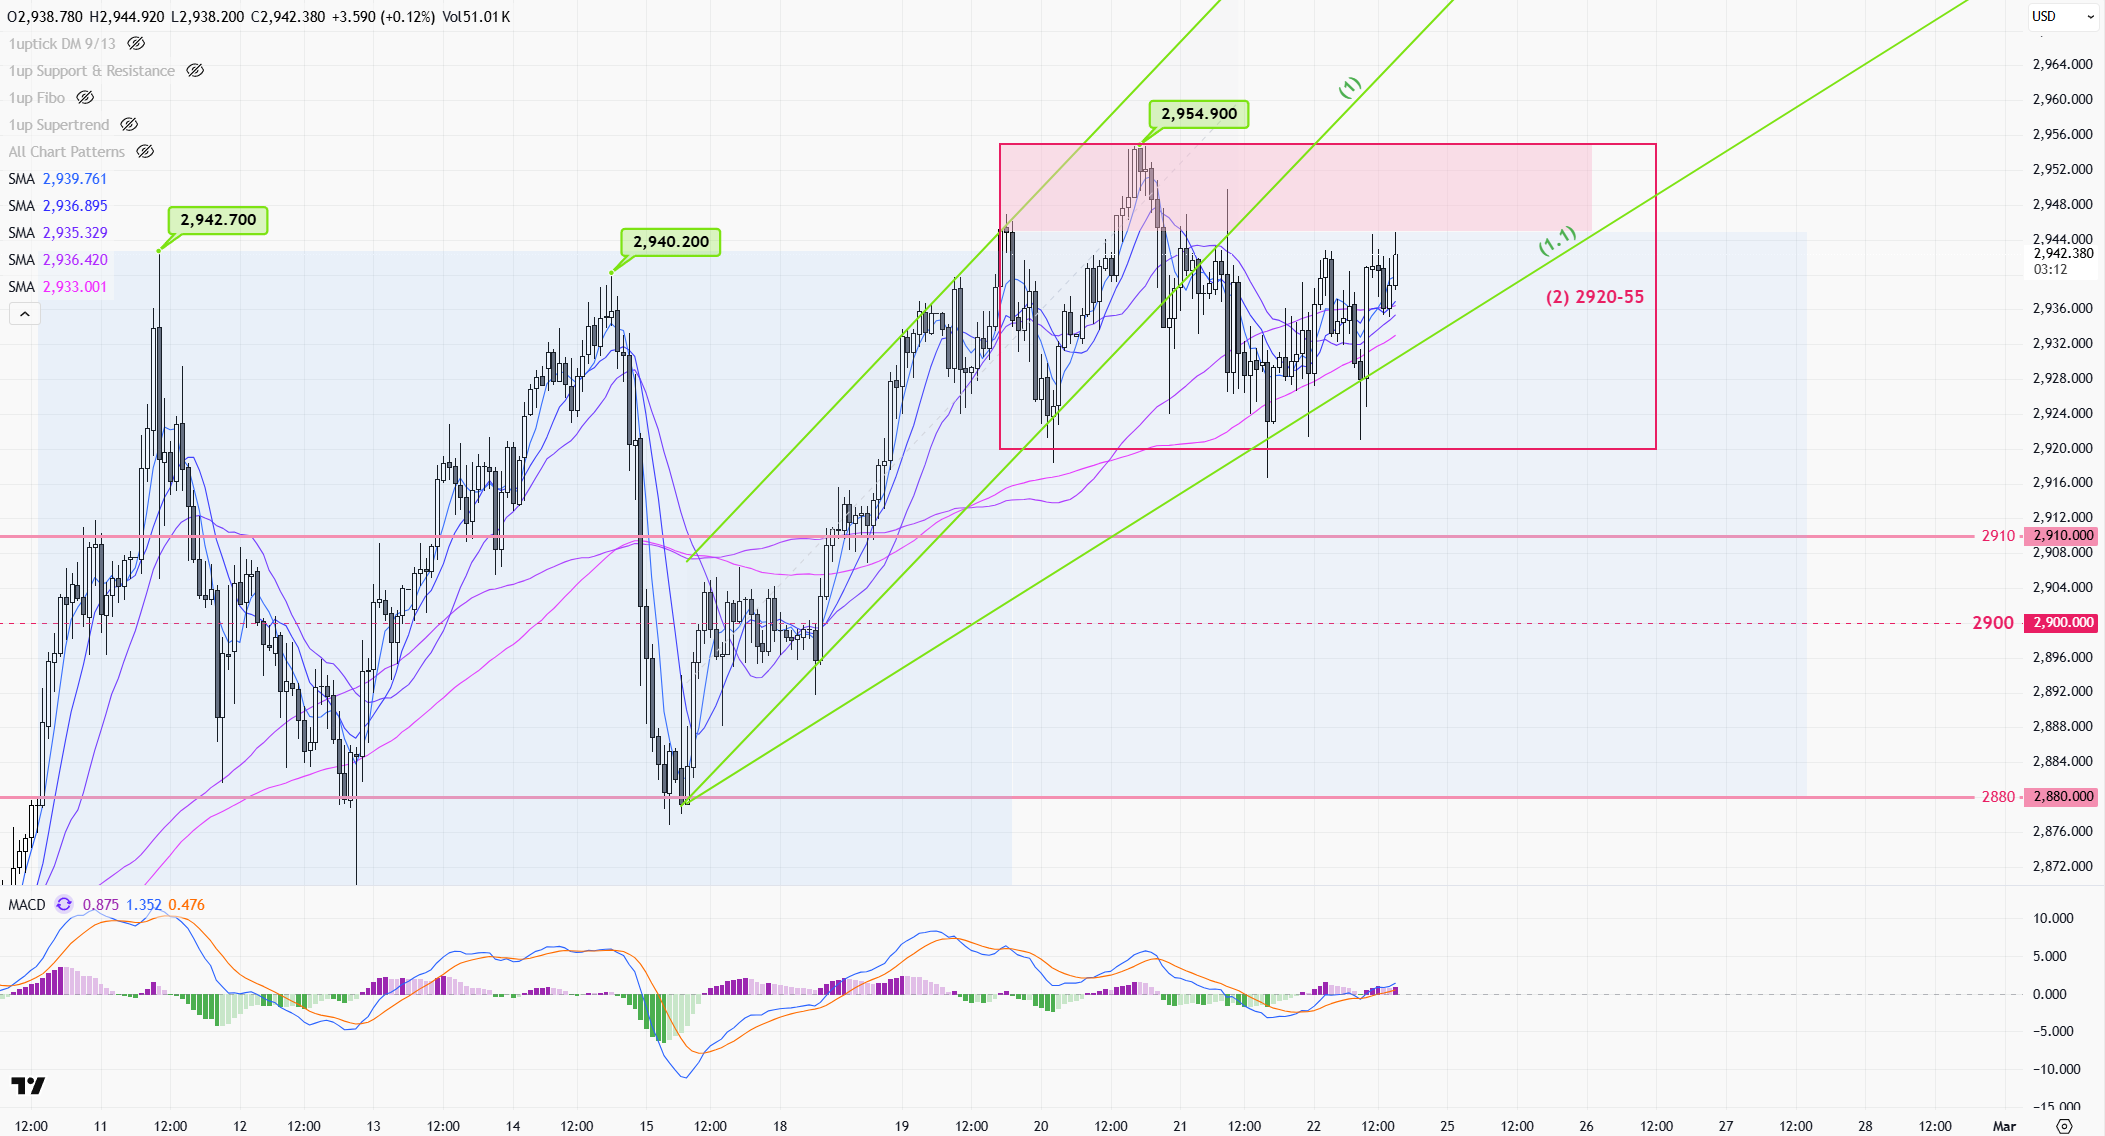
Gold prices continue to fluctuate near record highs. Early last week, the market was again driven by uncertainty over Trump’s tariff policy, hitting a new high of 2942. It was pushed toward 2863 by stronger-than-expected US inflation data on Wednesday, but the price rebounded quickly to 2940 before the U.S. session on Friday. As the peace talks began between Russia and the US, the geopolitical situation eased, profit taking/short-selling hit the market where the gold prices closed below 2900 near 2880.

The gold market will still be under the influence of Trump’s new economic policy this week. However, unless a more aggressive policy is introduced, the market is starting to adapt to the current market condition after nearly four weeks of news turmoil. With the prospect of a truce between Russia and Ukraine, it should be difficult for gold prices to hit a new high in the short term.

>

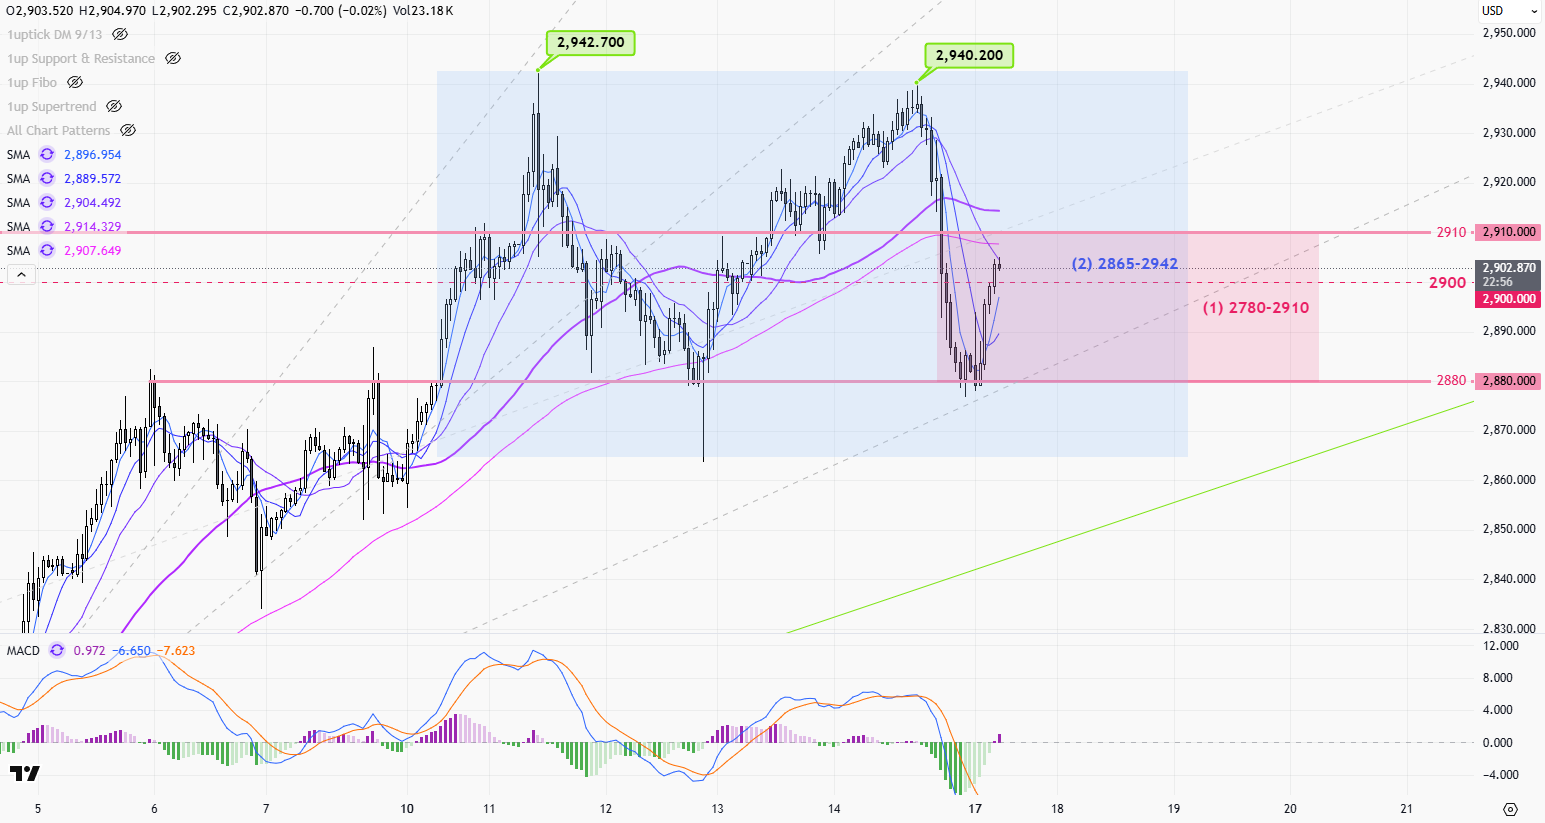
1-hr chart(above) > Monday is a U.S. holiday, the price should be bounded by the range of 2780-2910 (1). Later this week, a wider range can be expected between 2865-and 2942, and wait for the breakout before the next round of major trends.

>

Daily chart(above) > The 10-day moving average (3) dip-buying strategy mentioned last week is still valid. Note that last Friday’s sharp one-day pullback reflects the bear is starting to take control of the market, and it is important to be careful of a significant correction in the market this week. The breakout of the 10 days MA(3) will be the start of a bearish trend on the daily chart.

P. To

Gold Trend 03/03 – Major resistance @ 2880

Gold prices continue to fluctuate near record highs. Early last week, the market was again driven by uncertainty over Trump’s tariff policy, hitting a new high of 2942. It was pushed toward 2863 by stronger-than-expected US inflation data on Wednesday, but the price rebounded quickly to 2940 before the U.S. session on Friday. As the peace talks began between Russia and the US, the geopolitical situation eased, profit taking/short-selling hit the market where the gold prices closed below 2900 near 2880.

The gold market will still be under the influence of Trump’s new economic policy this week. However, unless a more aggressive policy is introduced, the market is starting to adapt to the current market condition after nearly four weeks of news turmoil. With the prospect of a truce between Russia and Ukraine, it should be difficult for gold prices to hit a new high in the short term.

>

1-hr chart(above) > Monday is a U.S. holiday, the price should be bounded by the range of 2780-2910 (1). Later this week, a wider range can be expected between 2865-and 2942, and wait for the breakout before the next round of major trends.

>

Daily chart(above) > The 10-day moving average (3) dip-buying strategy mentioned last week is still valid. Note that last Friday’s sharp one-day pullback reflects the bear is starting to take control of the market, and it is important to be careful of a significant correction in the market this week. The breakout of the 10 days MA(3) will be the start of a bearish trend on the daily chart.

P. To

Gold Trend 24/02 – Take advantage of the S-T sideway range!

Gold prices continue to fluctuate near record highs. Early last week, the market was again driven by uncertainty over Trump’s tariff policy, hitting a new high of 2942. It was pushed toward 2863 by stronger-than-expected US inflation data on Wednesday, but the price rebounded quickly to 2940 before the U.S. session on Friday. As the peace talks began between Russia and the US, the geopolitical situation eased, profit taking/short-selling hit the market where the gold prices closed below 2900 near 2880.

The gold market will still be under the influence of Trump’s new economic policy this week. However, unless a more aggressive policy is introduced, the market is starting to adapt to the current market condition after nearly four weeks of news turmoil. With the prospect of a truce between Russia and Ukraine, it should be difficult for gold prices to hit a new high in the short term.

>

1-hr chart(above) > Monday is a U.S. holiday, the price should be bounded by the range of 2780-2910 (1). Later this week, a wider range can be expected between 2865-and 2942, and wait for the breakout before the next round of major trends.

>

Daily chart(above) > The 10-day moving average (3) dip-buying strategy mentioned last week is still valid. Note that last Friday’s sharp one-day pullback reflects the bear is starting to take control of the market, and it is important to be careful of a significant correction in the market this week. The breakout of the 10 days MA(3) will be the start of a bearish trend on the daily chart.

P. To
Gold trend 17/2 – Ready to short?

Gold prices continue to fluctuate near record highs. Early last week, the market was again driven by uncertainty over Trump’s tariff policy, hitting a new high of 2942. It was pushed toward 2863 by stronger-than-expected US inflation data on Wednesday, but the price rebounded quickly to 2940 before the U.S. session on Friday. As the peace talks began between Russia and the US, the geopolitical situation eased, profit taking/short-selling hit the market where the gold prices closed below 2900 near 2880.

The gold market will still be under the influence of Trump’s new economic policy this week. However, unless a more aggressive policy is introduced, the market is starting to adapt to the current market condition after nearly four weeks of news turmoil. With the prospect of a truce between Russia and Ukraine, it should be difficult for gold prices to hit a new high in the short term.

>

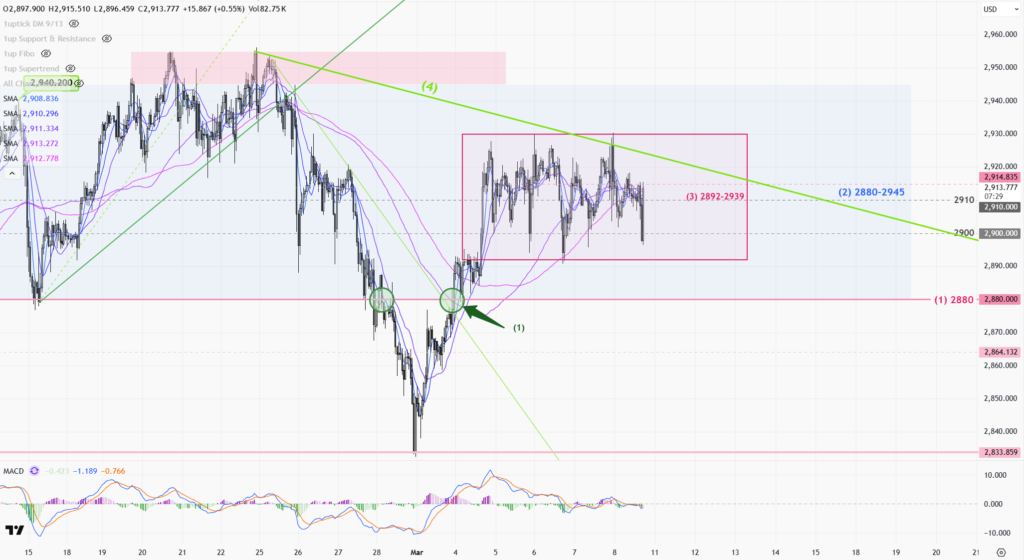
1-hr chart(above) > Monday is a U.S. holiday, the price should be bounded by the range of 2780-2910 (1). Later this week, a wider range can be expected between 2865-and 2942, and wait for the breakout before the next round of major trends.

>

Daily chart(above) > The 10-day moving average (3) dip-buying strategy mentioned last week is still valid. Note that last Friday’s sharp one-day pullback reflects the bear is starting to take control of the market, and it is important to be careful of a significant correction in the market this week. The breakout of the 10 days MA(3) will be the start of a bearish trend on the daily chart.

P. To
Gold Trend 10/02 – Tariff news dominates the market

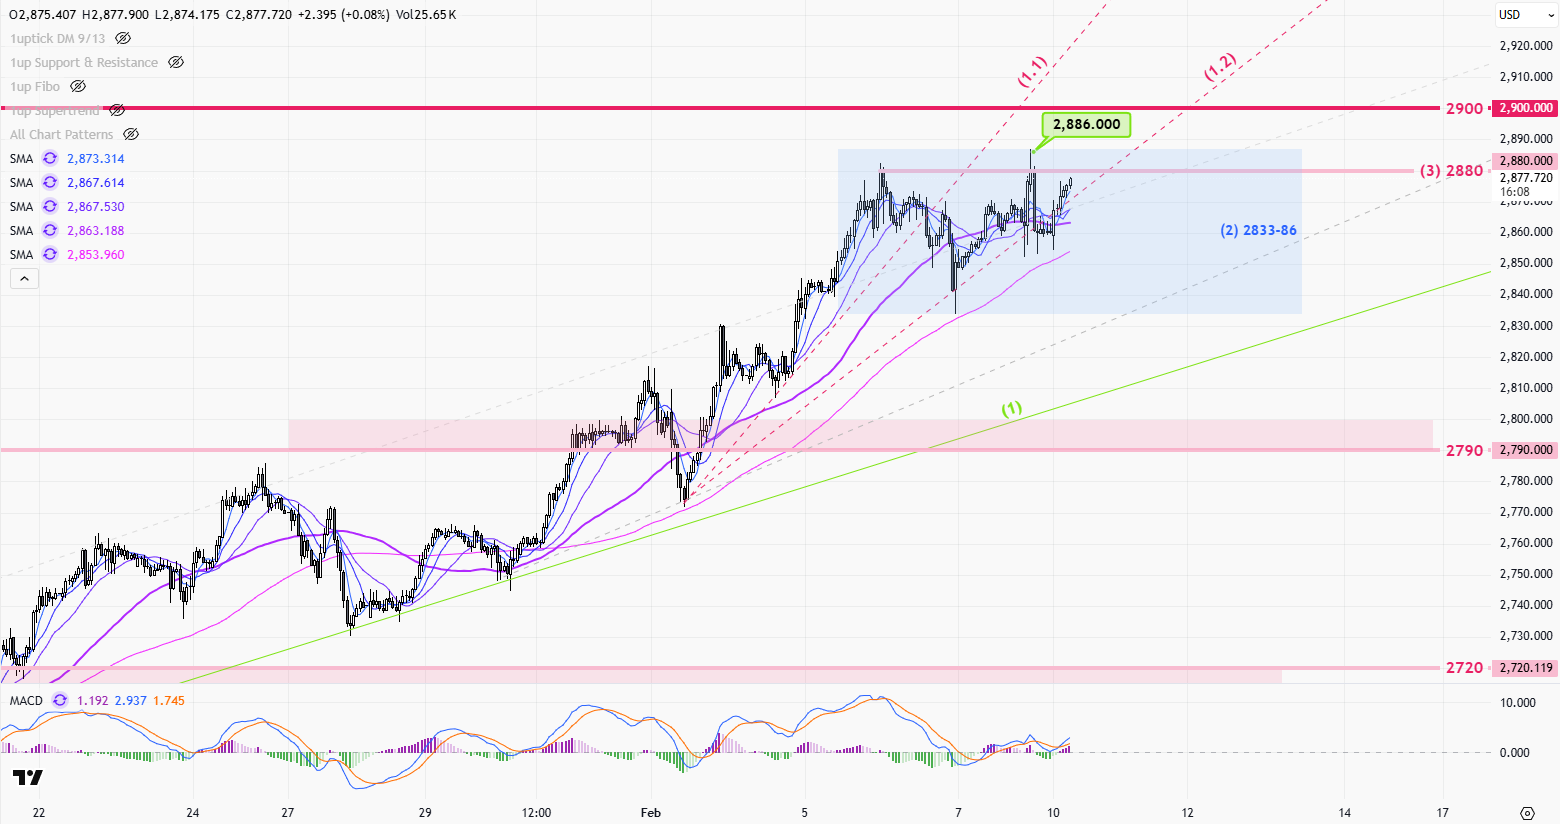
Triggered by Trump’s 25% tariffs on Canada and Mexico, Gold tested new highs last week. Although the tariffs were delayed for a month just hours after they were deployed, the news sent shockwaves to the market, pushing gold prices above last week’s highs early in the U.S. session on Monday. The upward momentum accelerated with the upward support accelerated from line (1) to (1.1), which rose to 2880 on Wednesday’s session. The market turned quiet as it waited for Friday’s US employment data, and the rally slowed slightly to (1.2). Although the Jan. non-farm jobs were smaller than expected, Friday’s U.S. data wasn’t bad at all, with the December figure being revised up to 300,000 and the latest unemployment rate revised down to 4.0% from 4.1% in the previous month. The pressure was on gold before the weekend.

The gold price continues to trade around its all-time high, hovering near 2880 with no signs of retreating. It is still imperative to keep an eye on the latest tariff policy developments in the United States and the responses of various countries. Fed Chairman Jerome Powell will have a hearing on Tuesday, and the US will release inflation data for January on Wednesday.

>

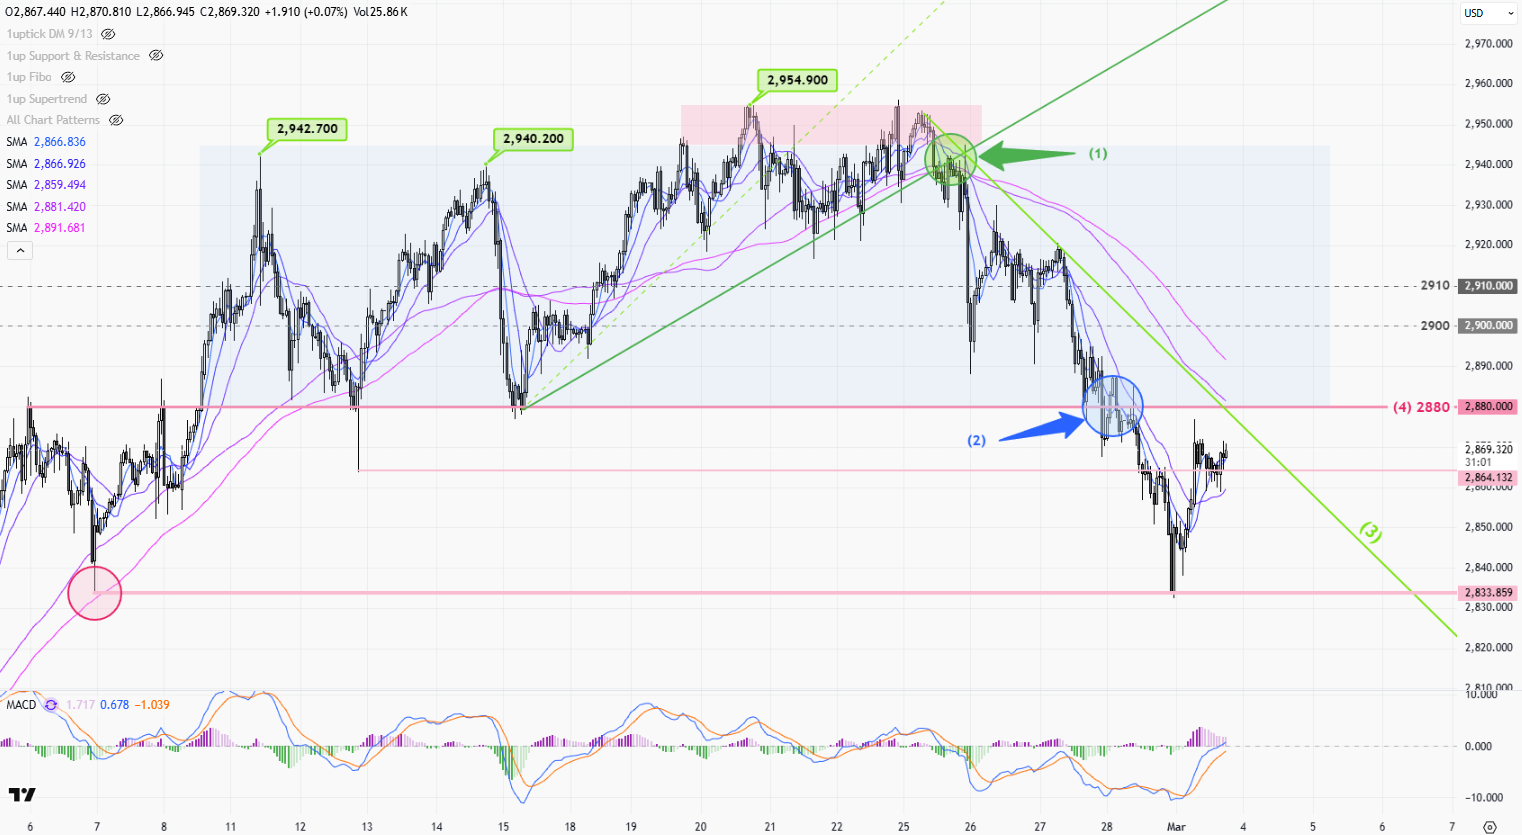
1-hour chart(above) > Although the upward trend slowed from (1.1) to (1.2) just before the weekend, there was no reversal signal in the 1-hour chart, and the price continued to stick to the all-time high of 2880. See if the price can break out from the resistance at 2880(3) in the next 12 hours, and if it fails to break up, the price will be sideway between 2833-86 early this week.

>

Daily Chart(above) > Gold prices temporarily showed S-T resistance at 2880, but the turnaround signal is still nowhere to be seen. An S-T long-entering point can be set at the 10-day moving average (4).

P. To

Long-buying has weakened after the record high?

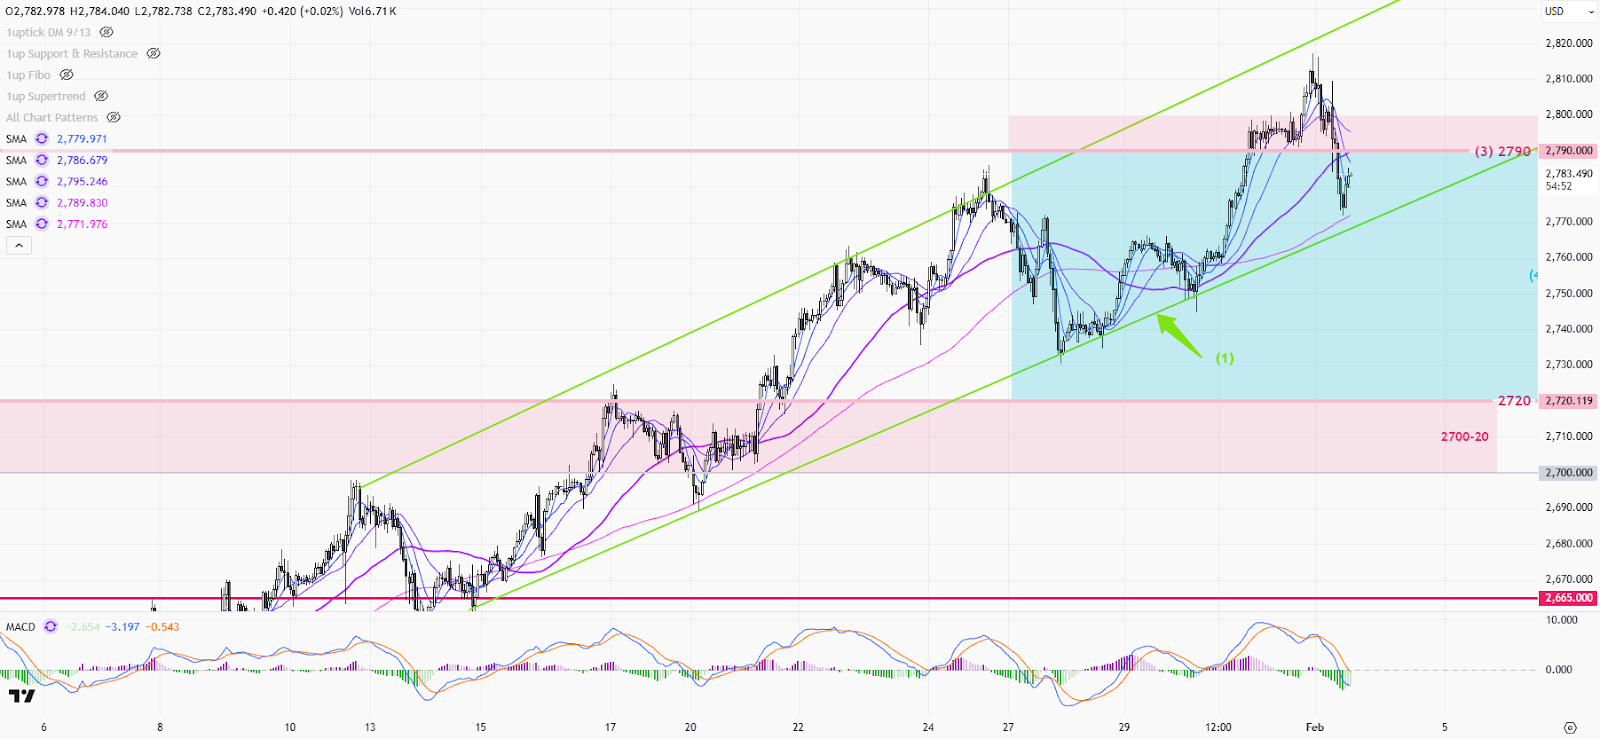
Following the decline from the previous week, the gold price tested the low near 2730 early last week. The market started to focus on the meetings of various central banks, 1st The Bank of Canada cut interest rates by 1/4%, followed by the Federal Reserve keeping interest rates unchanged, and then the ECB cut interest rates by 1/4 percentage point, led the price to rebound. The decline in global interest rates attracted gold buying, causing the gold price to cross the high of 2790. Driven by Trump’s tariff policy, the risk premium surged before the weekend, pushing gold prices to hit a new high of 2,817 during the U.S. session on Friday. But the price fell back to close at 2798, the week was up by $28.

Due to the weekend risk premium, the gold price hit a record high of 2817 on Friday, but the strong US dollar on Monday put pressure on the gold price. Last week’s US GDP and PCE inflation data, both reflected that the US economy keeps going strong, along with the tariff policy introduced by Trump over the weekend has further raised inflation expectations. Interest rates will remain high in the S-T just like Powell declared after the Fed. meeting last week, and gold prices will face pressure on the fundamental side.

In COMEX, the number of open interest(OI) has fallen after it reached 59k contracts on January 24. When gold prices hit a new high last week, both the trading volume and OI have reduced, reflecting investors are cautious in long-buying at current levels. The focus this week will be Friday’s U.S. employment data, as long as the numbers remain strong, gold prices will be under pressure once again.

>

1-hour chart(above) > The resistance above 2790 is still strong as the gold price failed to stabilize above 2790 back from the weekend. However, gold prices are still in the S-T rising channel(1). The price action will change to sideway only if the price falls below the support line(1). Notice that the upper resistance area is now at 2790-2800(5).

>

Daily chart > Although there was a clear selling before the market closed last Friday, the reversal signal has not yet appeared. Gold is still running in an upward trend along with the 10-day ma(6), wait for it to break where the bear will kick in.

P. To

Gold Trend 20/1 – Breakout or Dip ?

Gold price was pushed to a one-month-high by better-than-expected PPI and core CPI US economic figures last week. However, it was rejected by 2720 and the price has begun to consolidate before the market close on Friday. Israel and Palestine started to exchange hostages after reaching a ceasefire agreement, easing tensions in the Middle East, which put pressure on gold prices as markets opened on Monday. Today is a U.S. holiday, but the market will focus on the new president’s policies post-inauguration, believing that news will steer investment markets in the coming week. Whether gold prices will attempt new highs remains to be seen, with a key resistance level at 2720.

>

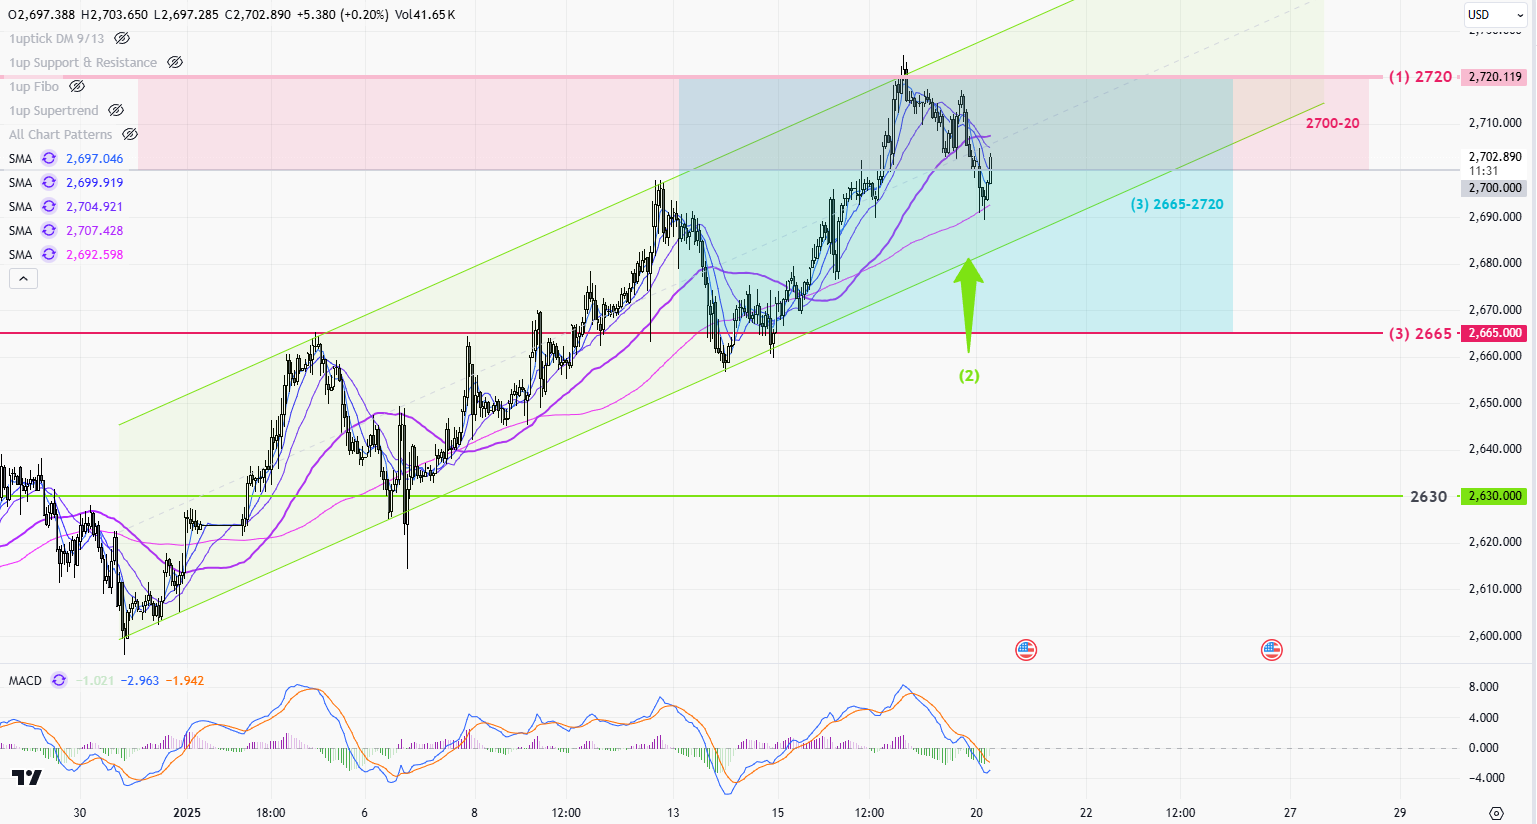
1-hr Chart(above) > The overall trend of gold prices was in line with our expectation last week, bounded by the range of 2665-2720. Despite the price being rejected by 2720(1) again, the S-T trend is still running within an upward channel(2), and remains bullish for now. Keep an eye on whether gold prices can break out from the upward channel(2) this week; once it falls below the upward channel, it would be the first sign of a possible trend reversal!

>

Daily Chart(above) > Gold prices tested the 2720 resistance for the third time last week, but this time, unlike the previous two attempts where prices rapidly fell within 24 hours after reaching the top, seems like, the market has already adjusted to prices above 2700. This week, the trend of gold prices will be influenced by the new U.S. President and his policies, so keep an eye out for any announcements. If gold prices can break through the 2720 resistance, it will trigger a new round of long-buying, with the next target at 2790. The support below lies at the ascending support line (4) and the 100-day moving average (5).

P. To

Gold double top pattern in progress ! Ready to do deep ?

Price Movement The gold daily chart reveals a significant bullish trend that persisted from May to early November, characterized by a steady rise with minor corrections. The price reached a peak around the 2,790 level, but this was followed by a sharp decline, indicating increased selling pressure. Subsequently, the price has been consolidating, finding support […]

Gold Trend – M-T downtrend is yet to complete ?

The downtrend in gold prices continued last week after turning back from the previous week’s high of 2726.The decline accelerated after the Fed’s interest rate meeting on Wednesday, failing to support at 2630(1) and falling back to a near three-month low near 2585.Then on Friday, US inflation data came down slightly, causing gold to bounce back above 2600 to close the week at 2622 (down $25 from the previous week).

As mentioned 2 weeks ago, there will be significant profit taking above 2700 while the year came close to the end. After the Fed’s meeting, the market fundamentals began to change again. Fed Chairman Powell indicated that the number of interest rate cuts will be reduced in 2025, from the previously expected 4 times to 2 times; next year’s relatively high inflation and high-interest rate environment will bring support to the US dollar while keeping gold prices under pressure. The new U.S. President’s tariff policy will be the dominate factor to lead the gold price next year.

>

1-Hour Chart (Above) > Gold price rebounded after hitting 2583 late last week, forming a S-T bottom. Expect the rebound top near 2650. The market should be relatively quiet this week, take 2580-2650 as the trading range for now until the market develop further this week.

>

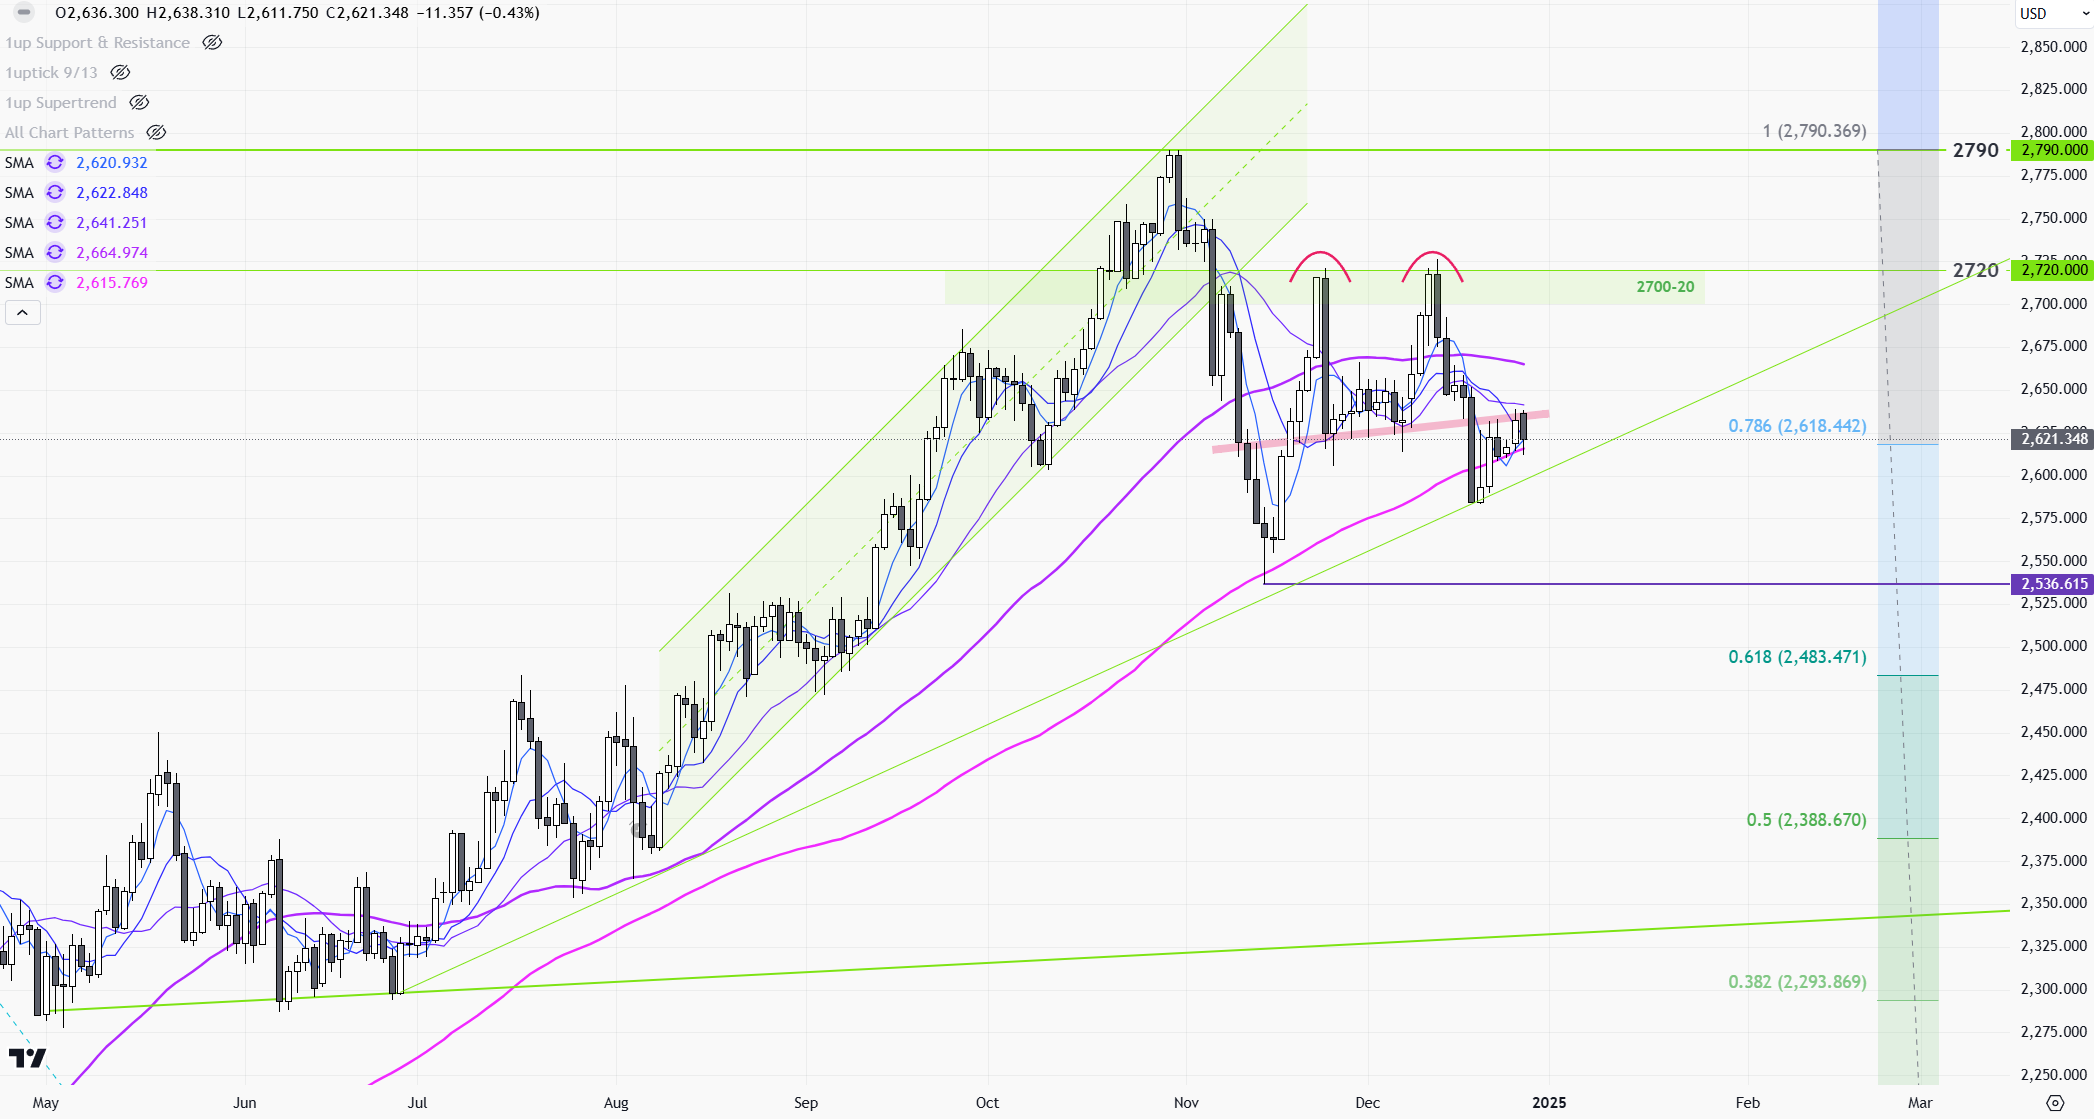
Daily Chart (Above) > Gold was rejected by 2700 twice on the daily chart, forming a double top pattern (3). Short selling should control the market as it cleared the support by the double top neckline (3.1) last week. After the current S-T rebound, the downtrend should resume and expected the price to return to around 2540-50 in the next 2 weeks. M-T operating range would be 2535-2730(4).

P. To

Gold Trend – Profit taking will dominate before the year’s end

Despite the initial drop on Monday, the gold price was relatively quiet last week.

The price shot up to around 2710 due to all the geopolitical tensions the week before. But then, it quickly retreated after an uneventful weekend. The risk premium dramatically reduced as the Asian market opened on Monday, leading to gold prices falling below 2700 early in the session. During the U.S. trading session on the same day, Trump announced the preliminary tariff policies on China, Canada, and Mexico via social media. The market anticipated a continued high-interest environment in the U.S. until 2025, exerting pressure on gold prices once more, causing them to dip below 2650(1). Gold prices stabilized thereafter, with a holiday atmosphere prevailing, prices rebounded throughout the week, closing near 2650.

Gold prices experienced significant fluctuations in the past couple of weeks due to the Russia/Ukraine and Israel/Palestine situations. However, as tensions ease, the upward momentum for price has waned. Heading into the final month of 2024, the gold market continues to be influenced by profit-taking sentiments, as the number of open interests in COMEX gold futures dropped, from 560,000 in early November to 450,000 last Friday. Unless there are significant changes in the fundamentals, gold prices are expected to keep consolidating.

This week, the focus will be on Friday’s US employment data, with market expectations suggesting a rebound in non-farm payrolls to 200,000. Gold prices are likely to face some pressure before the data is released.

>

1-hr chart(above) > Early in the Asian session today, the S-T trend turned bearish as the gold prices dipped below the support line(2). Strong selling resistance appeared near 2665 at the end of last week, suggesting initial operations within the 2600-2665(3) range. If this week’s US job data performs well in the latter part of the week, the gold price may once again visit below 2600.

>

Daily chart(above) > The overall trend for gold prices continues to adjust towards the 2600 mark, as mentioned last week. The significant selling pressure on Monday (4) is expected to continue influencing the S-T direction. The daily chart range is set between 2605-2665, and if there’s a downward breakout later this week, the downside target could be set around the 100-day MA near 2574 (6).

P. To

1uptick Analytics @

Maximize your profit at ease

Risk Warning​

*Investment involves risk. You may use the information, strategies and trading signals on this website for academic and reference purposes at your own discretion. 1uptick cannot and does not guarantee that any current or future buy or sell comments and messages posted on this website/app will be profitable. Past performance is not necessarily indicative of future performance. It is impossible for 1uptick to make such guarantees and users should not make such assumptions. Readers should seek independent professional advice before executing a transaction. 1uptick will not solicit any subscribers or visitors to execute any transactions, and you are responsible for all executed transactions.

© 2022-25 – 1uptick Analytics all rights reserved.


Risk Warning​

*Investment involves risk. You may use the information, strategies and trading signals on this website for academic and reference purposes at your own discretion. 1uptick cannot and does not guarantee that any current or future buy or sell comments and messages posted on this website/app will be profitable. Past performance is not necessarily indicative of future performance. It is impossible for 1uptick to make such guarantees and users should not make such assumptions. Readers should seek independent professional advice before executing a transaction. 1uptick will not solicit any subscribers or visitors to execute any transactions, and you are responsible for all executed transactions.

© 1uptick Analytics all rights reserved.

Home
Analysis
Calendar
Tools
Signals