


 |
| Gold V.1.3.1 signal Telegram Channel (English) |
Gold Trend 10/3 – Key support @ 2880
2025-03-11 @ 11:04
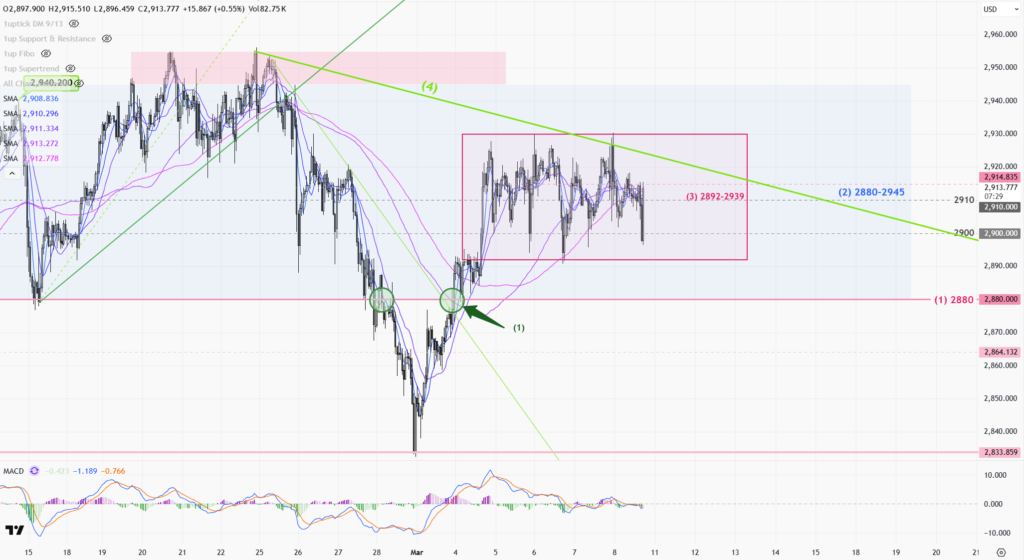
Gold prices were again driven by market news last week, fluctuating sideways above 2900. Earlier in the week, due to the unstable situation between Russia and Ukraine and the uncertainty of U.S. tariffs, gold prices broke through the key resistance of 2880 (1) on Monday, back to the range of 2880-2945 (2) from last week. After that, gold kept oscillating between 2892-2930 (3). Although Friday’s U.S. jobs data came in worse than expected, it failed to boost gold prices further, and the week closed around 2910.
There will be several important US data releases this week, including US inflation data on Wednesday and the US producer price index on Thursday. The market expects both inflationary figures will be slightly slower than last month, which is initially good for gold prices. But keep in mind that the overall trends in gold prices are still mainly driven by news related to Trump’s policies, just like last week’s US employment data, which, even if it was bad, didn’t manage to push gold prices up. Under such market conditions, gold prices will continue to hover sideways near 2900 until new policy news triggers the next breakout.

1-hour chart (above) > The gold price has bounced back above 2880, with the range returning to 2880-2945. Last week’s movement was relatively narrow, ranging between 2892-2939. After last Friday’s U.S. employment data, a downward trend on the 1-hour chart has formed, which could put S-T selling pressure on the gold price. Later this week, we still need to watch if the price can hold above 2880.
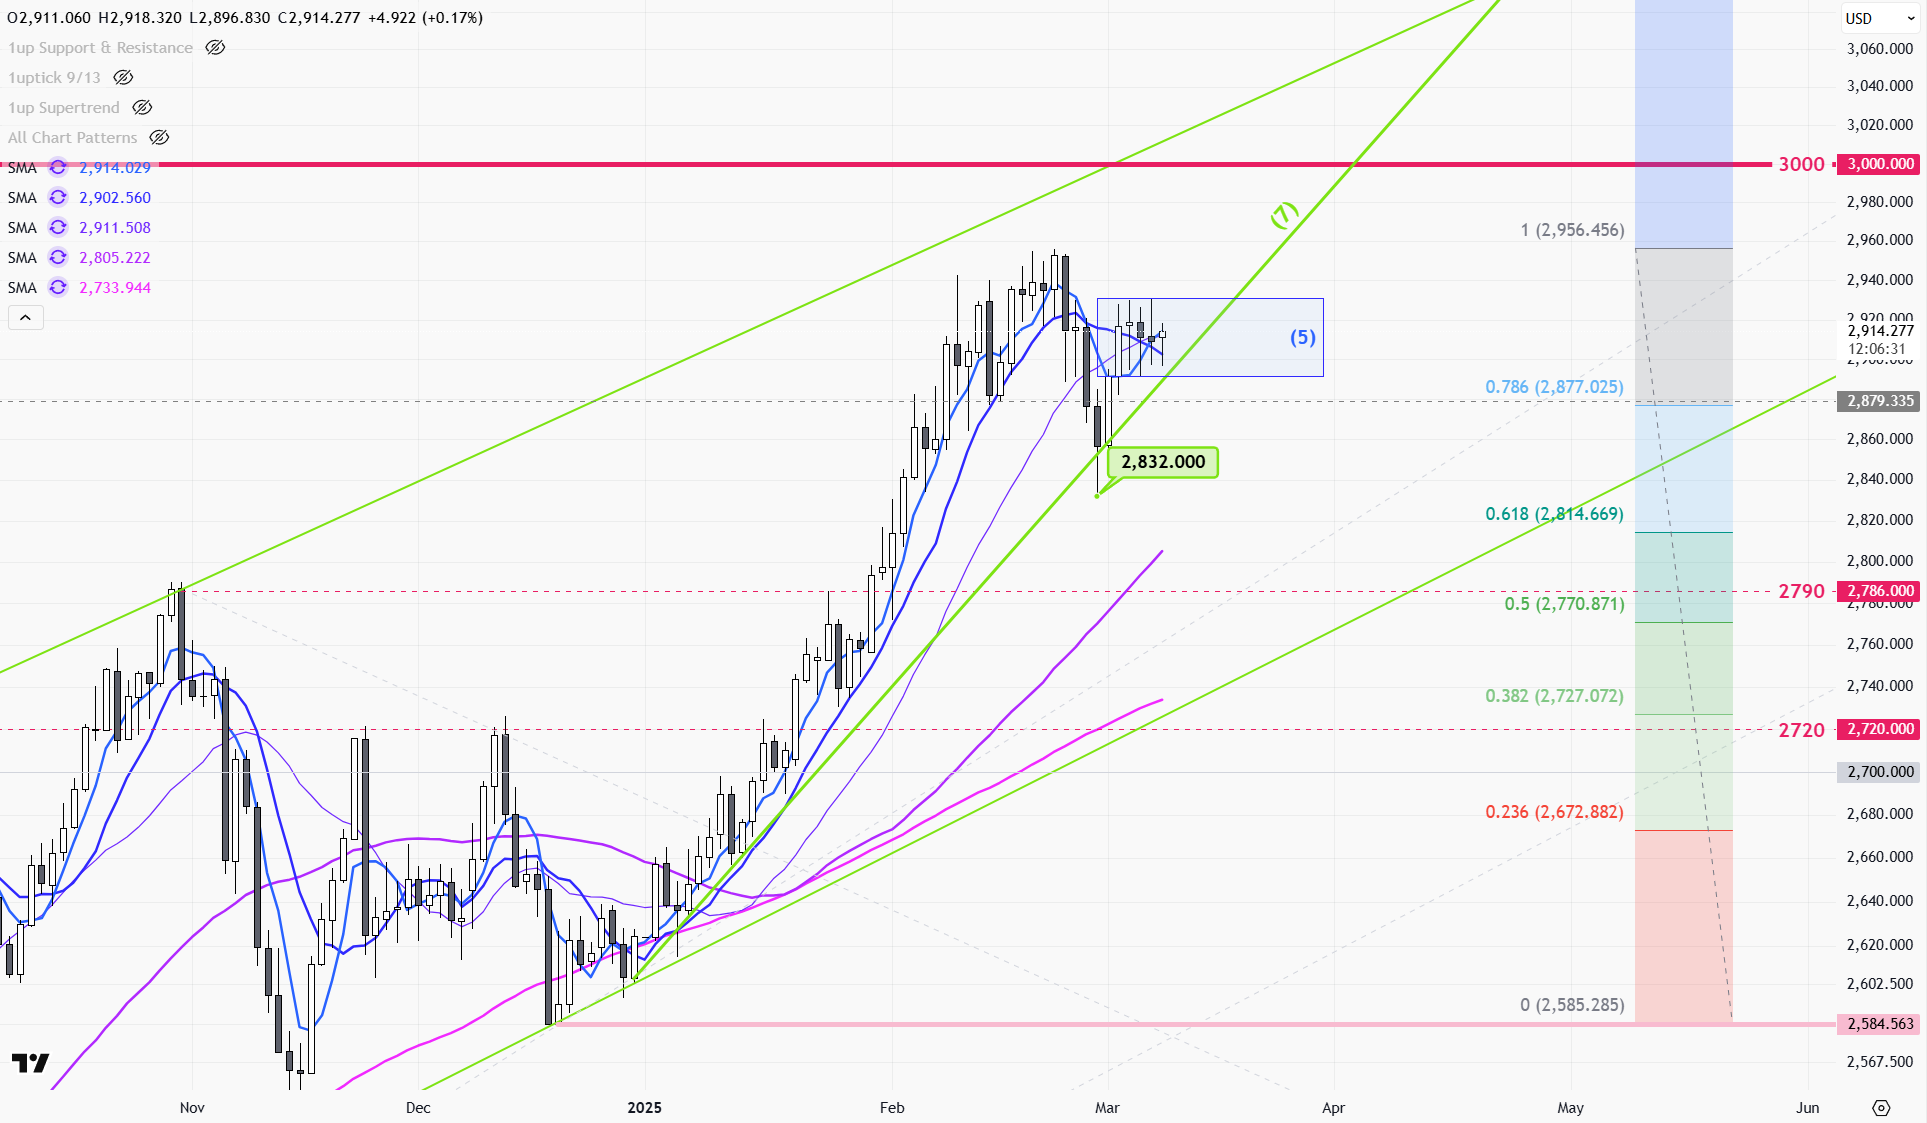
Daily Chart (above) > The rebound last week showed a new upward support(7). But the narrow range trading last week (5) reflects a temporary lack of upward momentum in the market. Gold prices need to keep rising this week in order to maintain the upward momentum along the trend line(7); the rally will end if the price breaks out from the support line(7).
P.To