

 |
| Gold V.1.3.1 signal Telegram Channel (English) |
Gold Trend 10/01
2022-01-10 @ 16:24
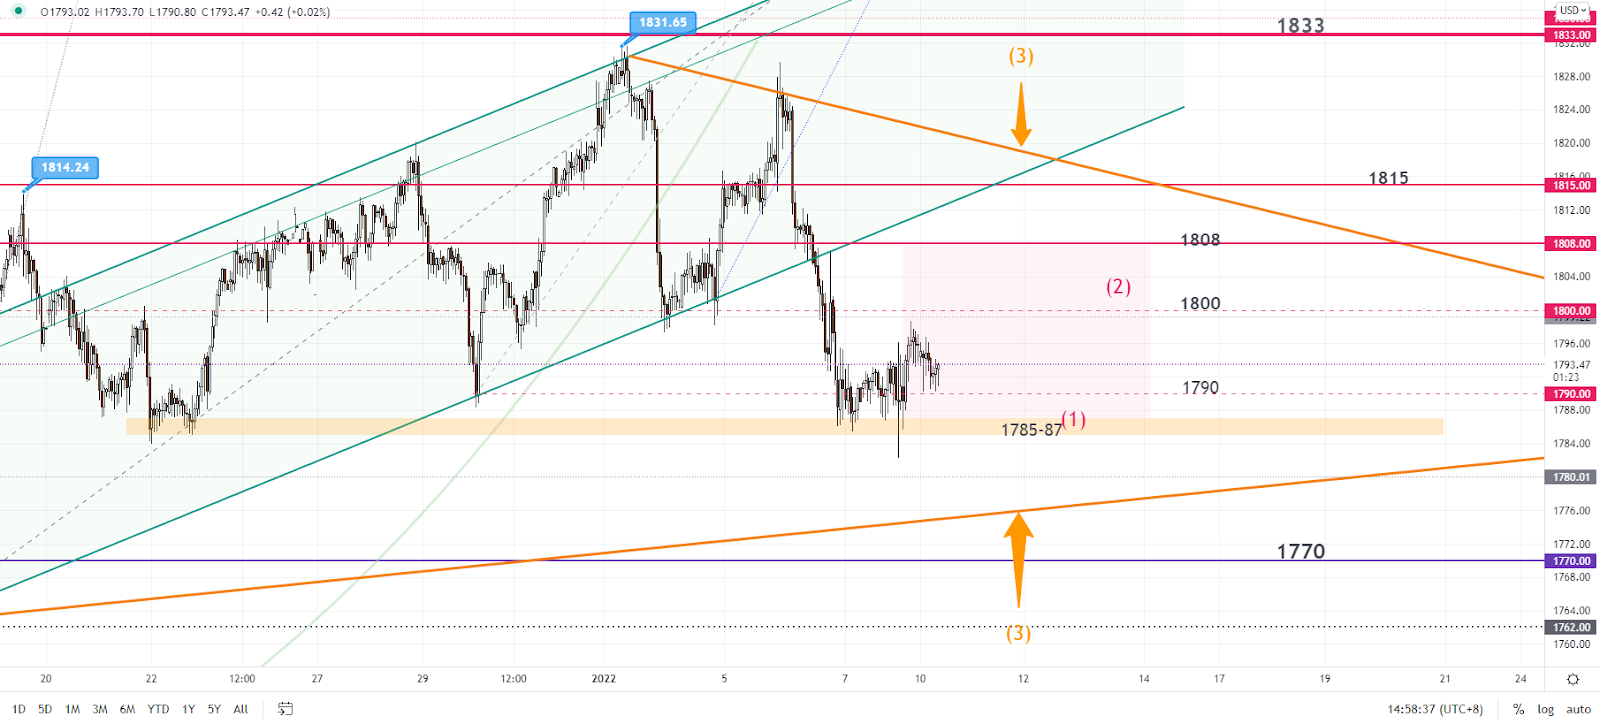
Considering it was a non-farm night, the gold price was relatively stable last Friday. The market opened near 1791. Throughout the Aaisan and European session, the price has fluctuated in a USD 7 range between 1785-92. At the US session opening, the price touched a 2 week low near 1782 then rebounded. The day ended up at 1796, up slightly by USD 5.
The market doesn’t seem to have a direction at the moment. The buying orders placed at 1785-87 are currently supporting the price in S-T. As time goes by, the triangle structure(3) is continuing to narrow down the price range. Expect the price to respect the pattern in the next 48-72 hours and 1785-92 should be the S-T range for today.
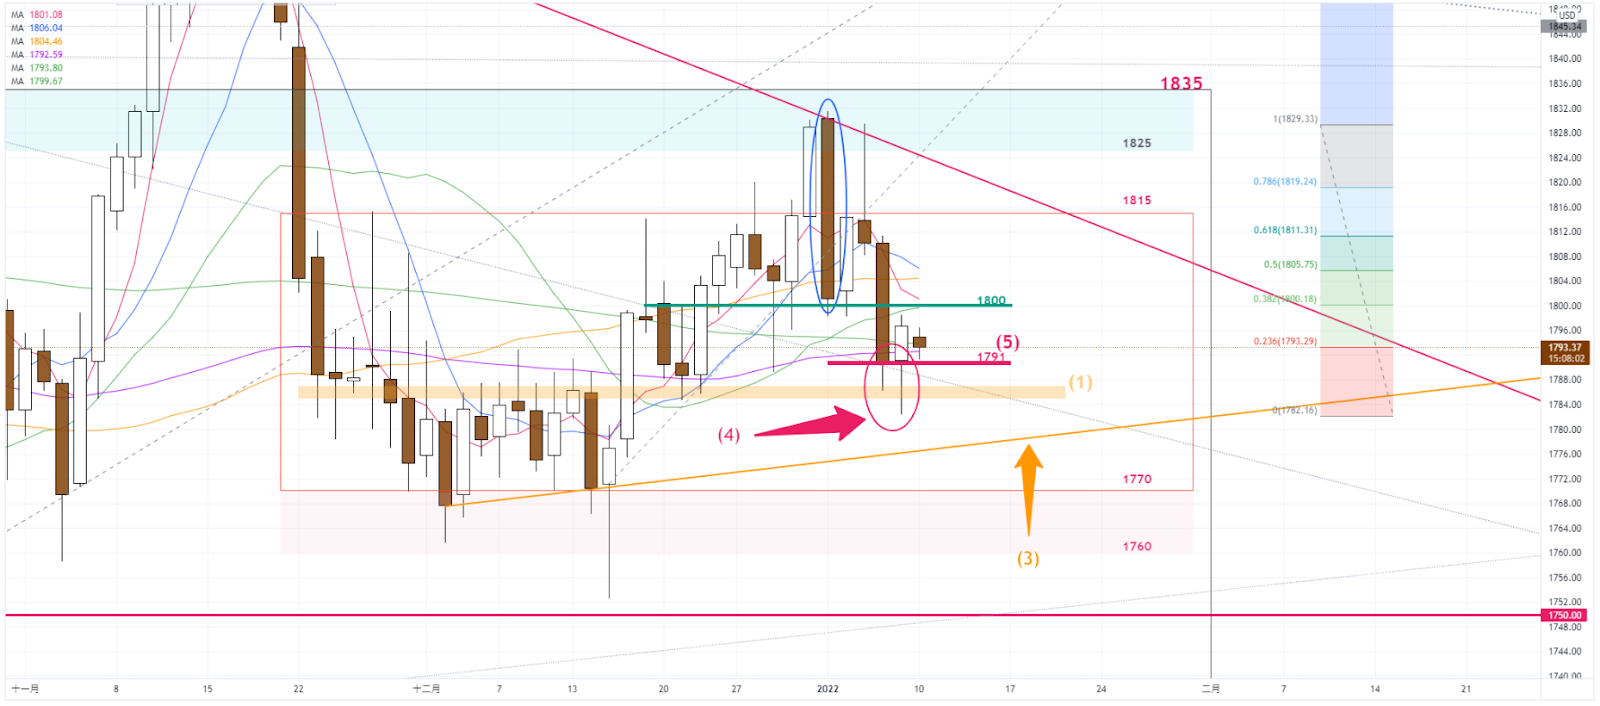
The price has touched 1787 for 2 consecutive days, however, the selling is not strong enough to keep the price below 1790 before the day’s end. An S-T bottom out signal(4) has been formed on the daily chart. Unless the price can close below 1791(5), otherwise a S-T rebound will begin, target at 1800 or higher.
S-T Resistances:
1806
1800-1797
1795
Market price: 1793
S-T Supports:
1790
1785
1780
Risk Disclosure: Gold Bullion/Silver (“Bullion”) trading carries a high degree of risk, and may not be suitable for all investors. The high degree of leverage can work against you as well as for you. This article is for reference only and is not a solicitation or advice to trade any currencies and investment products . Before deciding to trade Bullion you should carefully consider your investment objectives, level of experience, and risk appetite. The possibility exists that you could sustain a loss of some or all of your initial investment or even more in extreme circumstances (such as Gapping underlying markets) and therefore, you should not invest money that you cannot afford to lose. You should be aware of all the risks associated with trading Bullion, and seek advice from an independent financial advisor if you require. Client should not make investment decision solely based on the point of view and information on this article.