

 |
| Gold V.1.3.1 signal Telegram Channel (English) |
Gold Trend 20/01
2022-01-20 @ 14:48

Gold surged over USD 26 yesterday. The day has started at 1813. Early in the Asian session, the price was traded between 1810-15. The climb has officially begun after the price broke out from 1820 and the resistance trendline(1) at the European session. Buying accelerated at the US session, and the price reached day-high near market closing at 1843, the day ended at 1840.
Gold surged over USD 26 yesterday. The day has started at 1813. Early in the Asian session, the price was traded between 1810-15. The climb has officially begun after the price broke out from 1820 and the resistance trendline(1) at the European session. Buying accelerated at the US session, and the price reached day-high near market closing at 1843, the day ended at 1840.
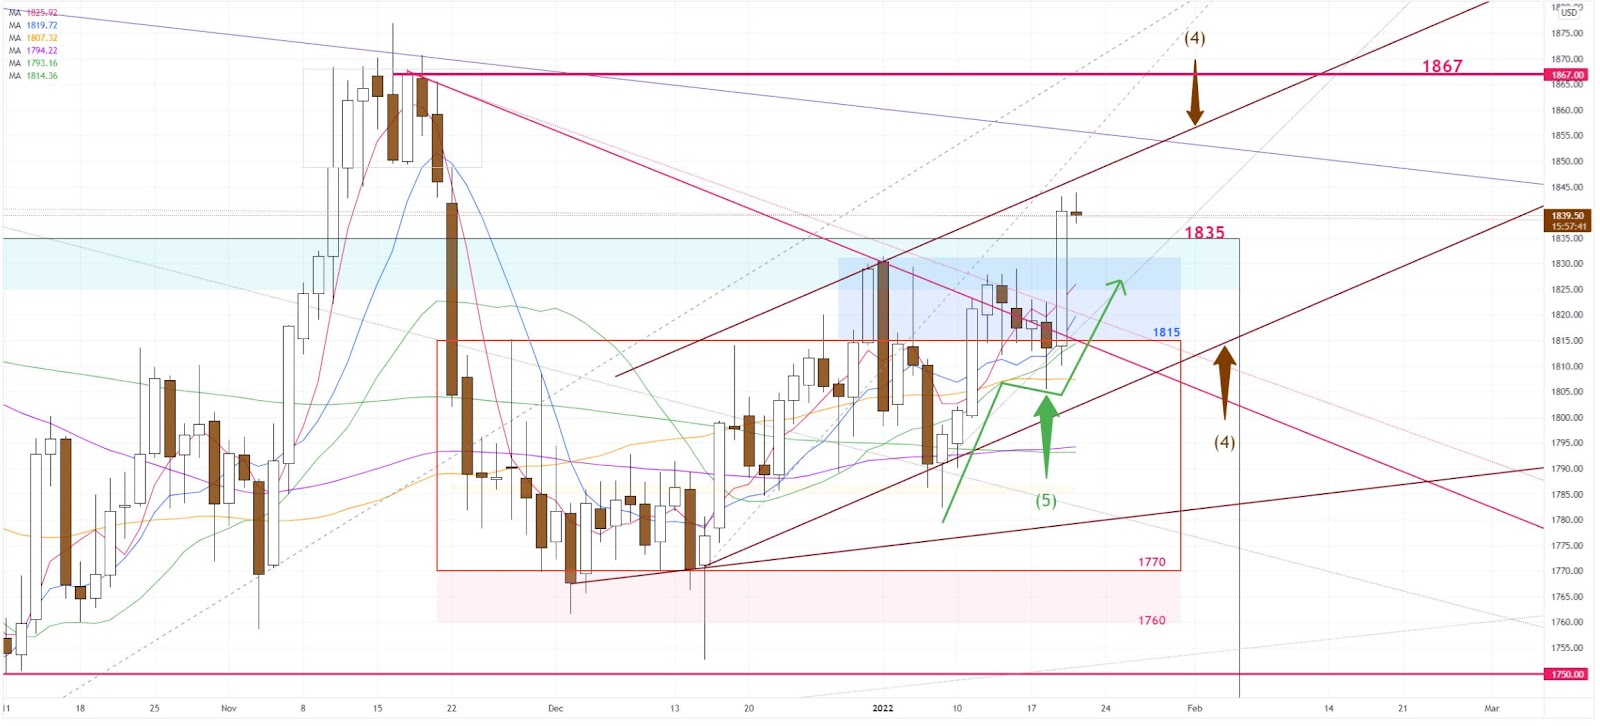
In line with our expectations, the flag shape pattern (5) continues to develop in the daily chart. The uptrend channel(4) should dominate the daily chart in M-T.
S-T Resistances:
1855
1850
1840-43
Market price: 1830
S-T Supports:
1835
1830-28
1825
Risk Disclosure: Gold Bullion/Silver (“Bullion”) trading carries a high degree of risk, and may not be suitable for all investors. The high degree of leverage can work against you as well as for you. This article is for reference only and is not a solicitation or advice to trade any currencies and investment products . Before deciding to trade Bullion you should carefully consider your investment objectives, level of experience, and risk appetite. The possibility exists that you could sustain a loss of some or all of your initial investment or even more in extreme circumstances (such as Gapping underlying markets) and therefore, you should not invest money that you cannot afford to lose. You should be aware of all the risks associated with trading Bullion, and seek advice from an independent financial advisor if you require. Client should not make investment decision solely based on the point of view and information on this article.