Copper trend remains bearish!

Home  Copper trend remains bearish!


Copper trend remains bearish!

2024-12-28 @ 21:50

Price Movement

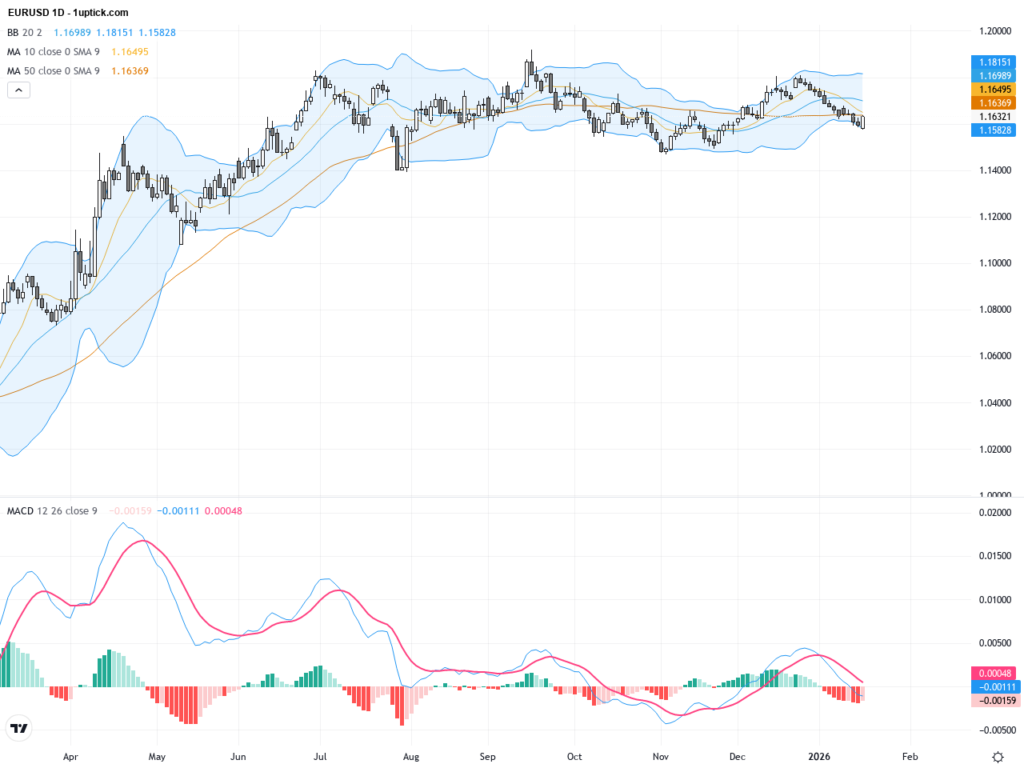
The daily chart of copper reveals a significant long-term downtrend following a peak at $5.2010. The price has been making lower highs and lower lows, indicating persistent bearish momentum. Recent sessions show copper trading within a descending triangle pattern, with resistance around the $4.3355 level and support near $3.9230. This consolidation reflects indecision among traders, with potential for a breakout as the pattern progresses. Volume appears to be declining, suggesting that volatility may increase soon as copper approaches a decision point.

Technical Analysis

  • Chart Patterns: Descending triangle formation, suggesting potential for a breakout breakdown.
  • Moving Averages: Prices are below the 50-day and 200-day simple moving averages, indicating bearish sentiment.
  • Support and Resistance: Key resistance at $4.3355; critical support at $3.9230.
  • MACD: MACD line below the signal line, reinforcing bearish momentum.
  • Volume: Declining volume on recent price movement signals possible increase in volatility.
  • Outlook

    In the short to medium term, copper remains under pressure within a descending triangle pattern. The current setup suggests a bearish outlook unless a significant catalyst shifts sentiment. A break below $3.9230 could trigger further declines, while a push above $4.3355 might initiate a reversal. Traders should watch for increased volume as a potential signal of a breakout’s direction. Given the ongoing economic uncertainties, caution is advised, with close monitoring of additional macroeconomic indicators and market sentiment required for informed trading decisions.

    Tag:
    Latest Chart Pattern
    GBPUSD 1d

    GBPUSD 1d

    HGc1 1d

    HGc1 1d

    USDJPY 1h

    USDJPY 1h

    1 2 3 14

    1uptick Analytics @

    Maximize your profit at ease

    Risk Warning​

    *Investment involves risk. You may use the information, strategies and trading signals on this website for academic and reference purposes at your own discretion. 1uptick cannot and does not guarantee that any current or future buy or sell comments and messages posted on this website/app will be profitable. Past performance is not necessarily indicative of future performance. It is impossible for 1uptick to make such guarantees and users should not make such assumptions. Readers should seek independent professional advice before executing a transaction. 1uptick will not solicit any subscribers or visitors to execute any transactions, and you are responsible for all executed transactions.

    © 2022-25 – 1uptick Analytics all rights reserved.


    Risk Warning​

    *Investment involves risk. You may use the information, strategies and trading signals on this website for academic and reference purposes at your own discretion. 1uptick cannot and does not guarantee that any current or future buy or sell comments and messages posted on this website/app will be profitable. Past performance is not necessarily indicative of future performance. It is impossible for 1uptick to make such guarantees and users should not make such assumptions. Readers should seek independent professional advice before executing a transaction. 1uptick will not solicit any subscribers or visitors to execute any transactions, and you are responsible for all executed transactions.

    © 1uptick Analytics all rights reserved.

    Home
    Analysis
    Calendar
    Tools
    Signals