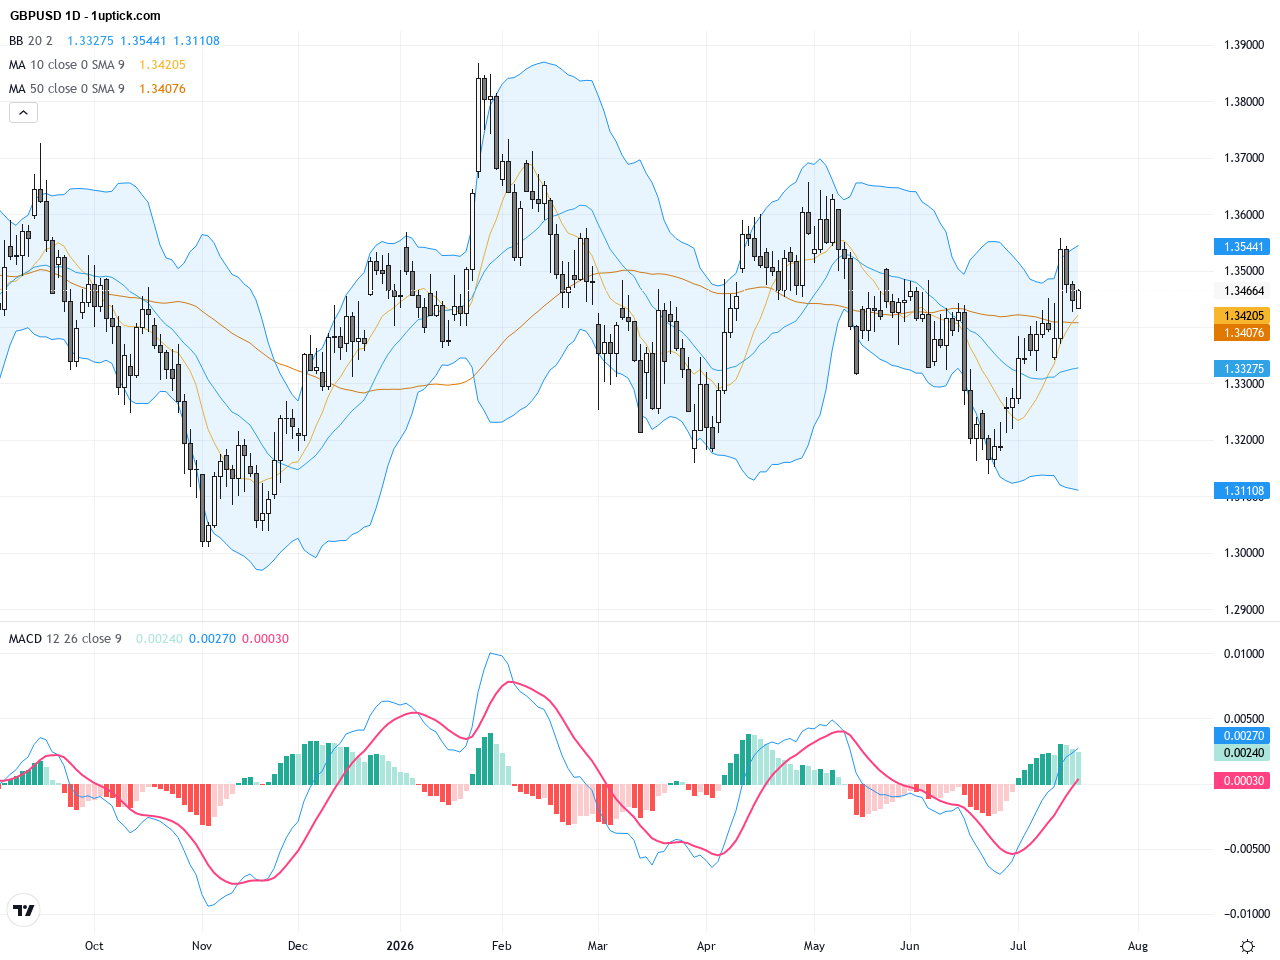
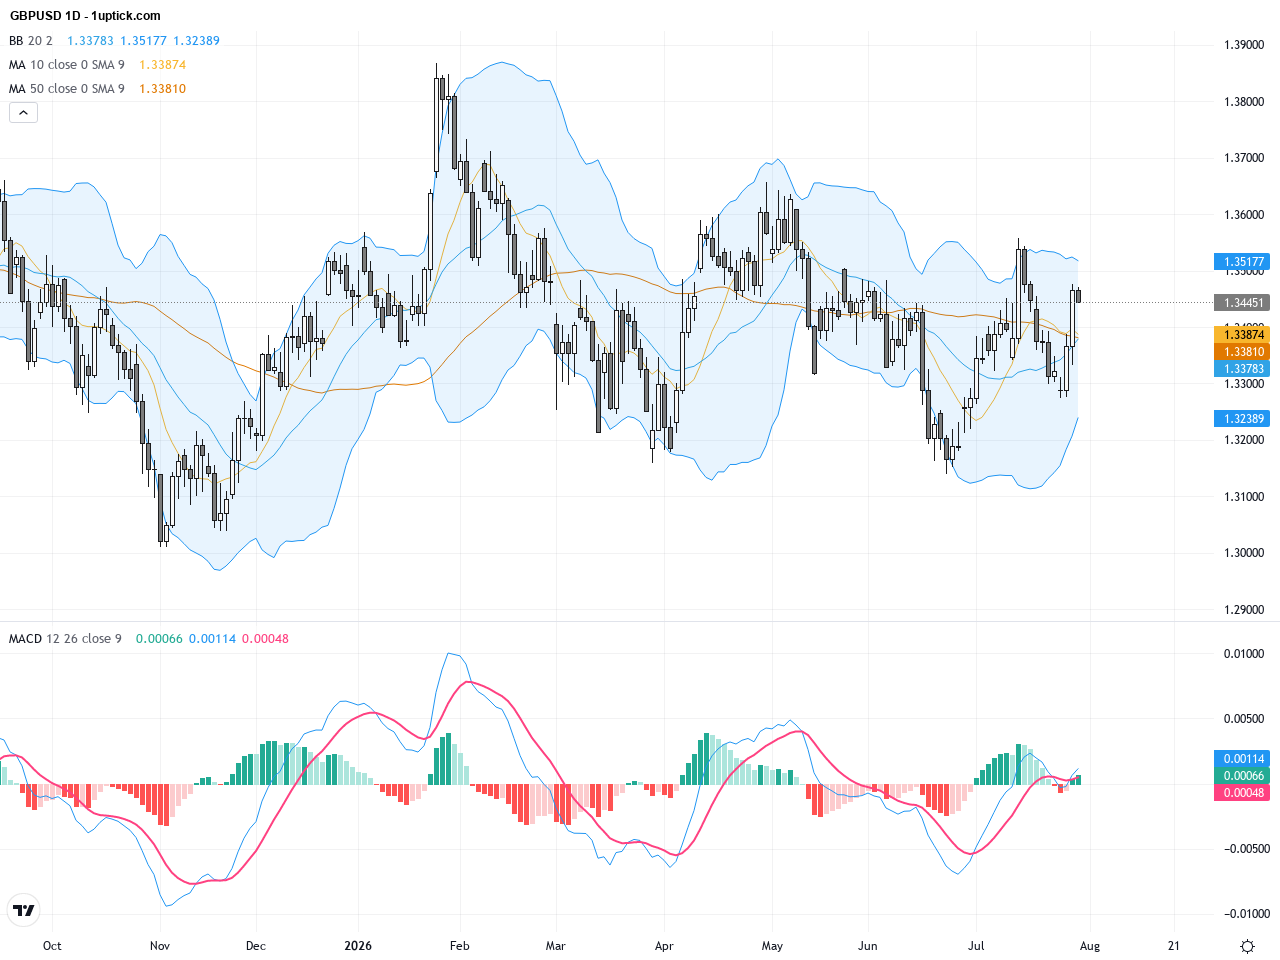
GBPUSD: Critical Technical Support Holds Amid Market Volatility and Rate Hike Uncertainty, July 31, 2026
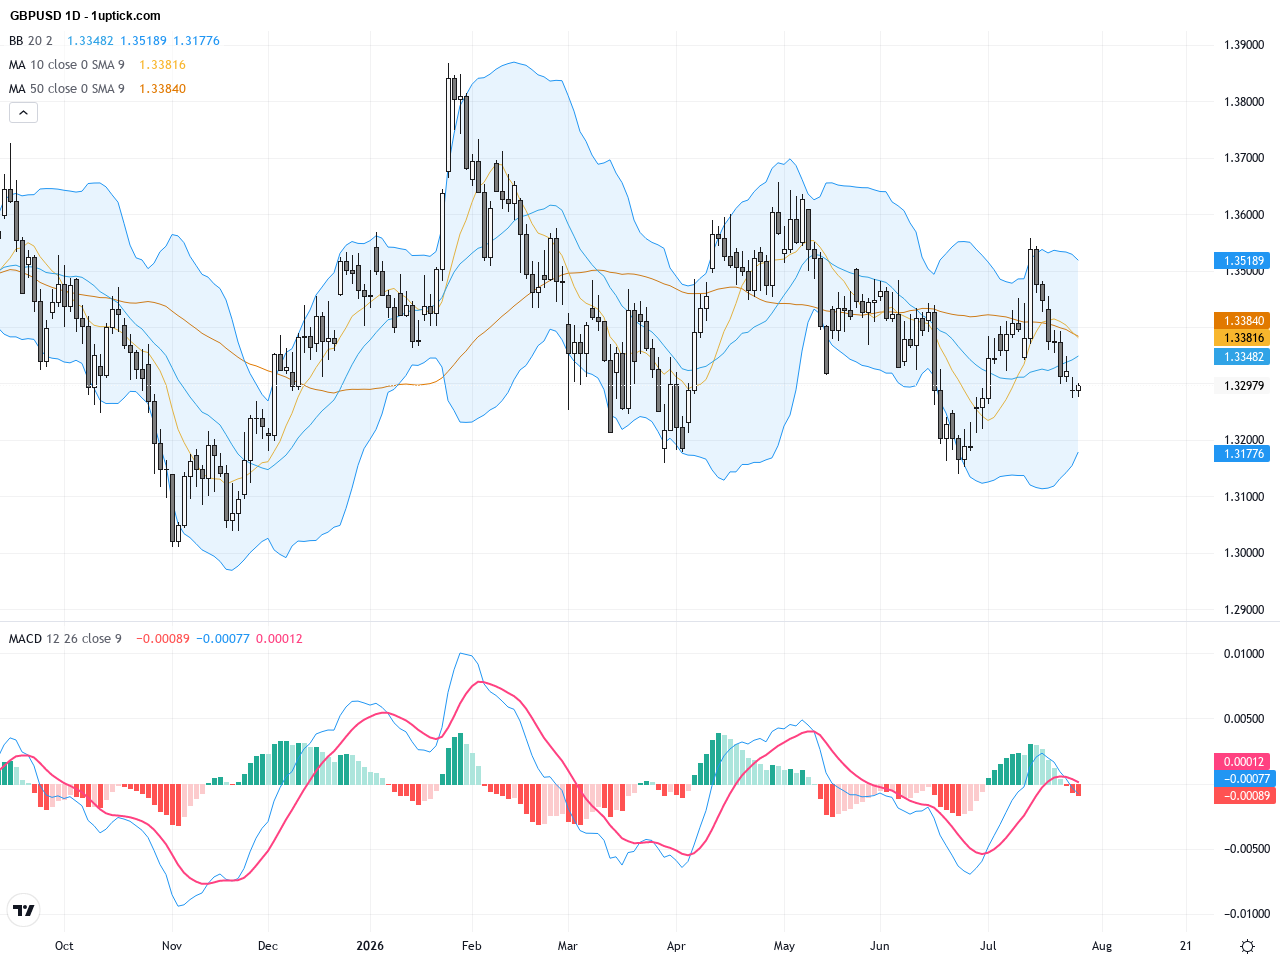
Over the past three trading days, GBPUSD experienced a volatile ride, initially rallying for three consecutive sessions before retreating to close at 1.34458 yesterday, down approximately 0.14%. The British pound has been influenced by multiple factors including a less hawkish-than-expected Bank of England rate vote, broad dollar weakness, and increased geopolitical tensions in the Middle East adding a risk premium. Market sentiment this week shifted from optimism to caution, shaping the current GBPUSD price outlook. For everyday investors, it resembles a scenario where economic policy and global political risks dynamically impact currency values, underscoring the need for vigilance and flexible strategies.