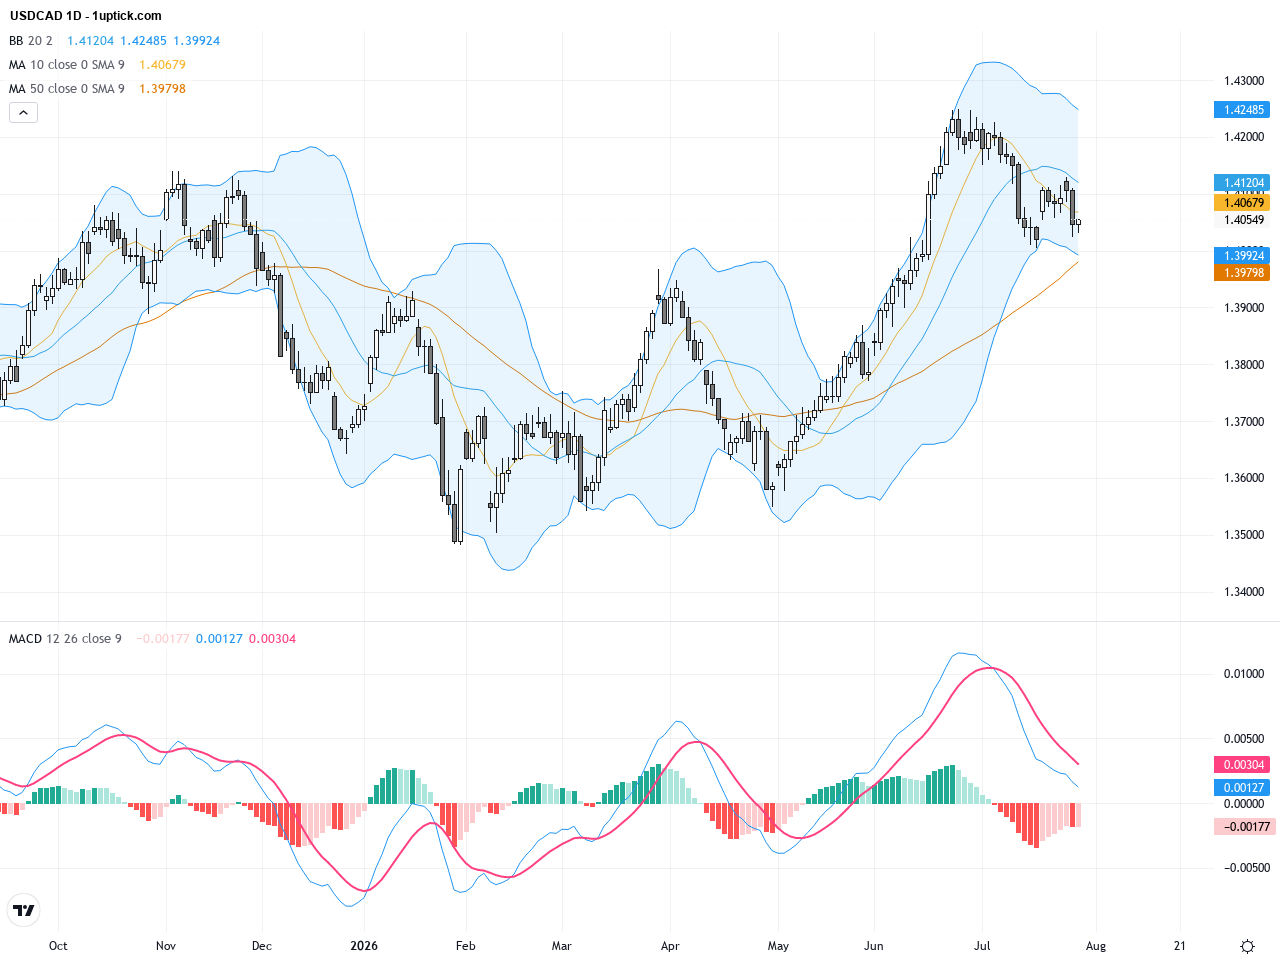
USDCAD: Key Support and Resistance Levels After Fed Holds Rates Steady, July 30, 2026
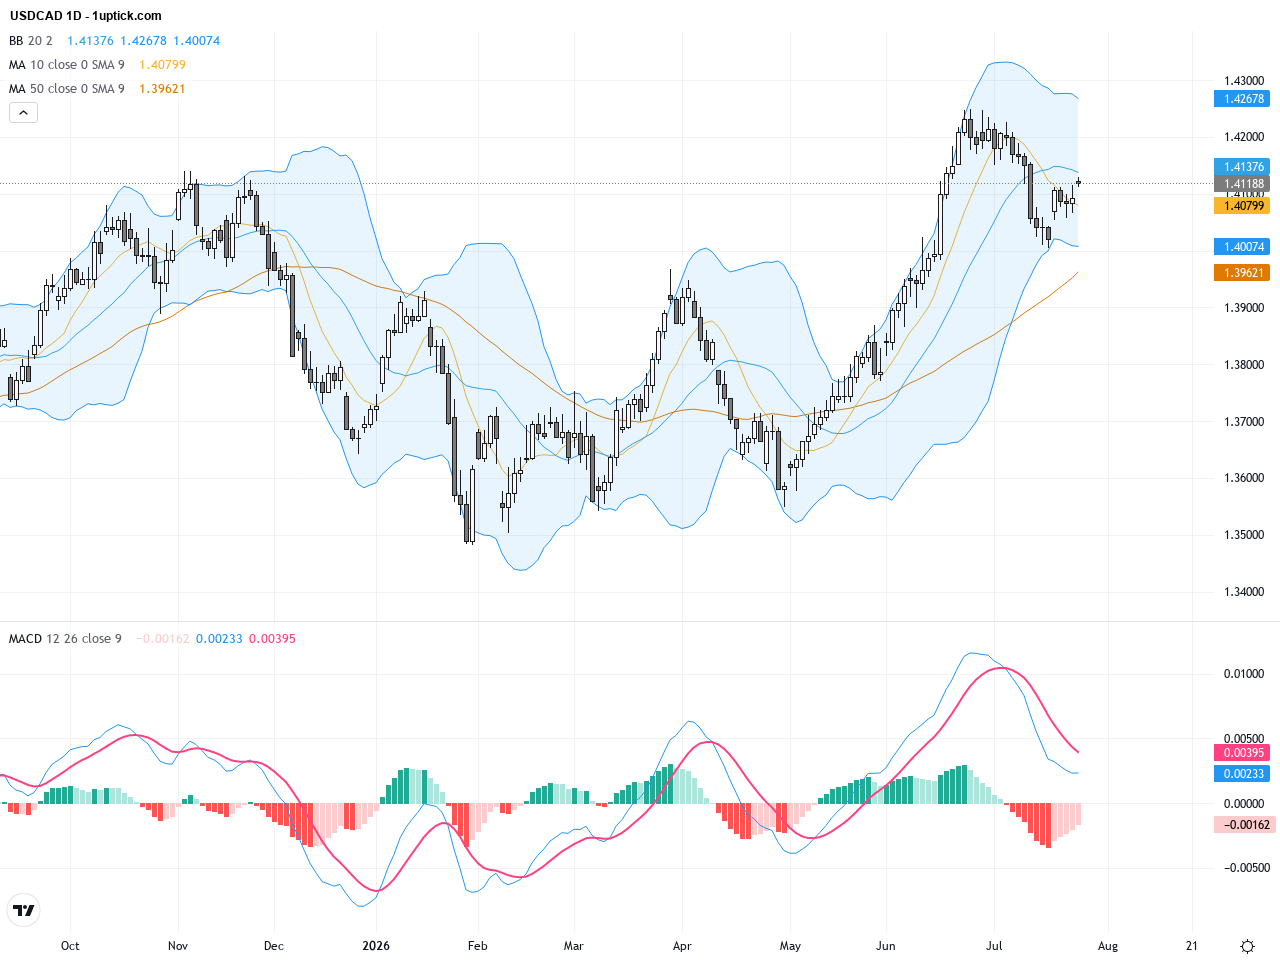
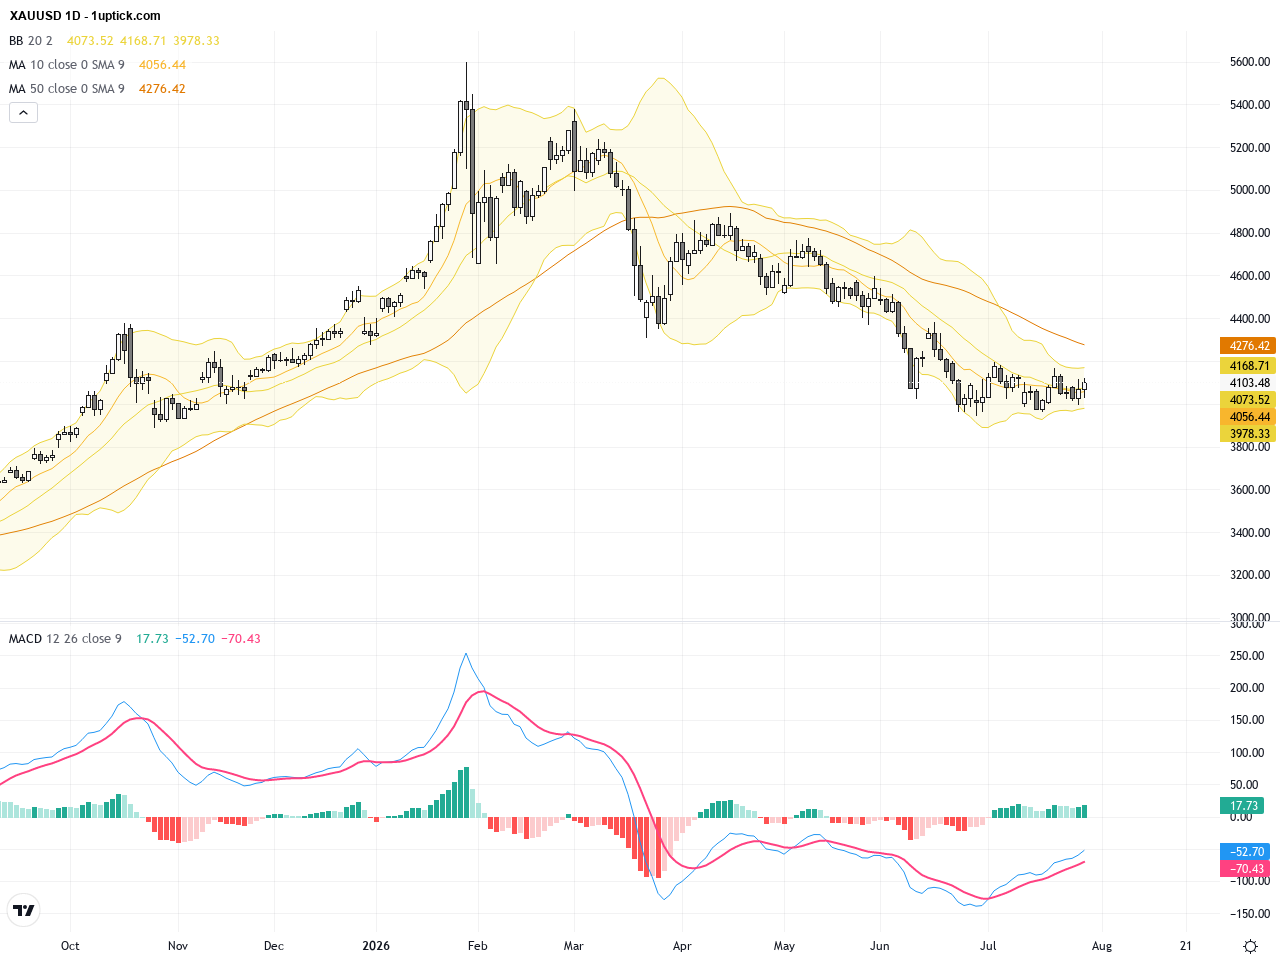
Over the past three trading days, USDCAD has shown modest fluctuations around 1.4055, closing yesterday at 1.40549. The Federal Reserve’s decision to hold interest rates steady has weighed on the dollar, while the Canadian dollar benefits from supportive oil prices. However, US tariffs and reduced risk demand limit further CAD gains, resulting in a consolidation range between 1.40 and 1.4150. For investors, this suggests a wait-and-see approach as the market awaits further Fed policy signals and oil market developments. Traders should closely watch technical support and resistance levels for potential breakout opportunities.