WTI Crude Oil: Technical Patterns Signal Strong Uptrend Amid Middle East Tensions, July 9, 2026
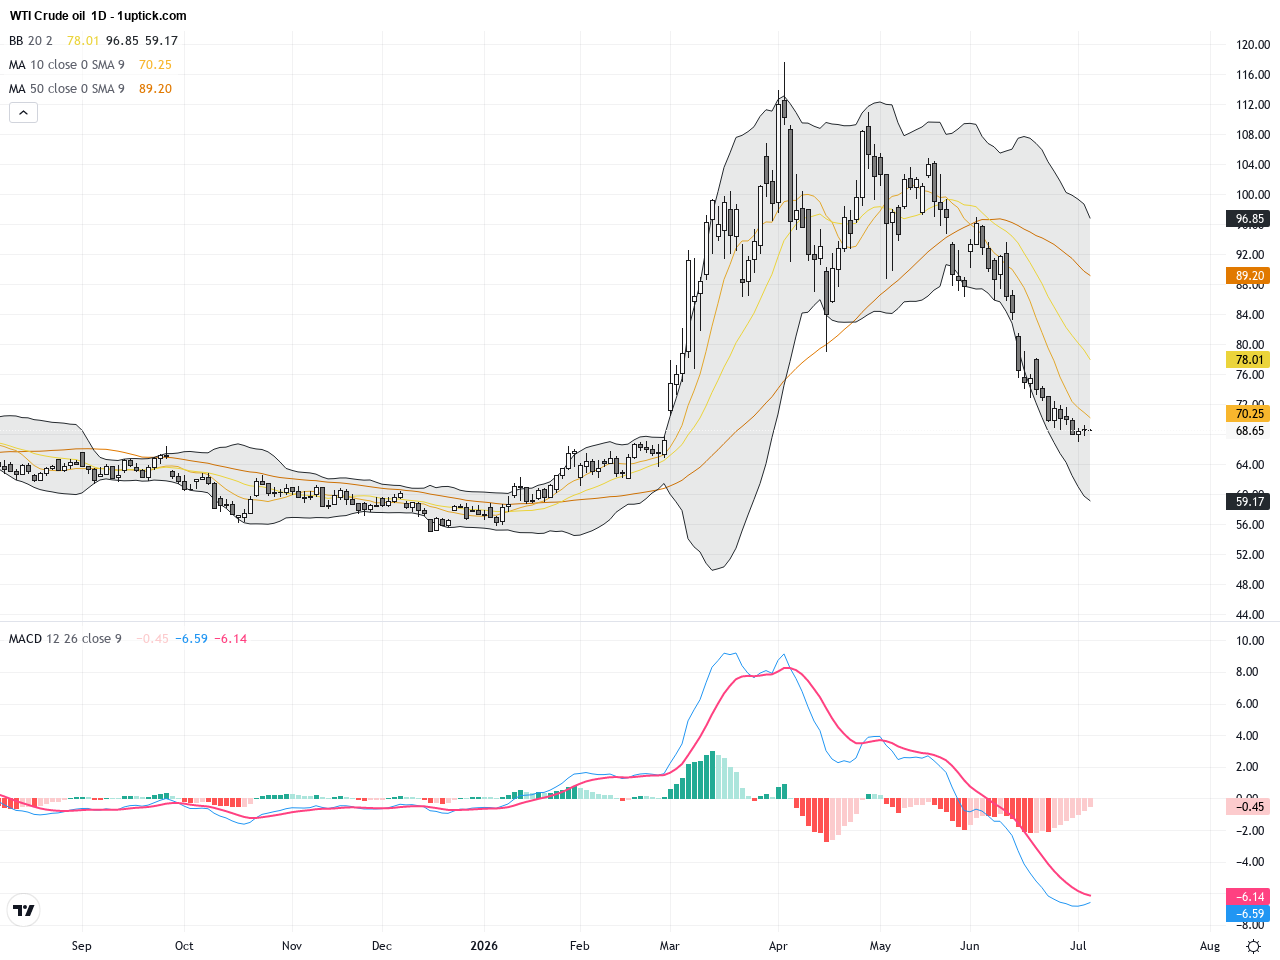
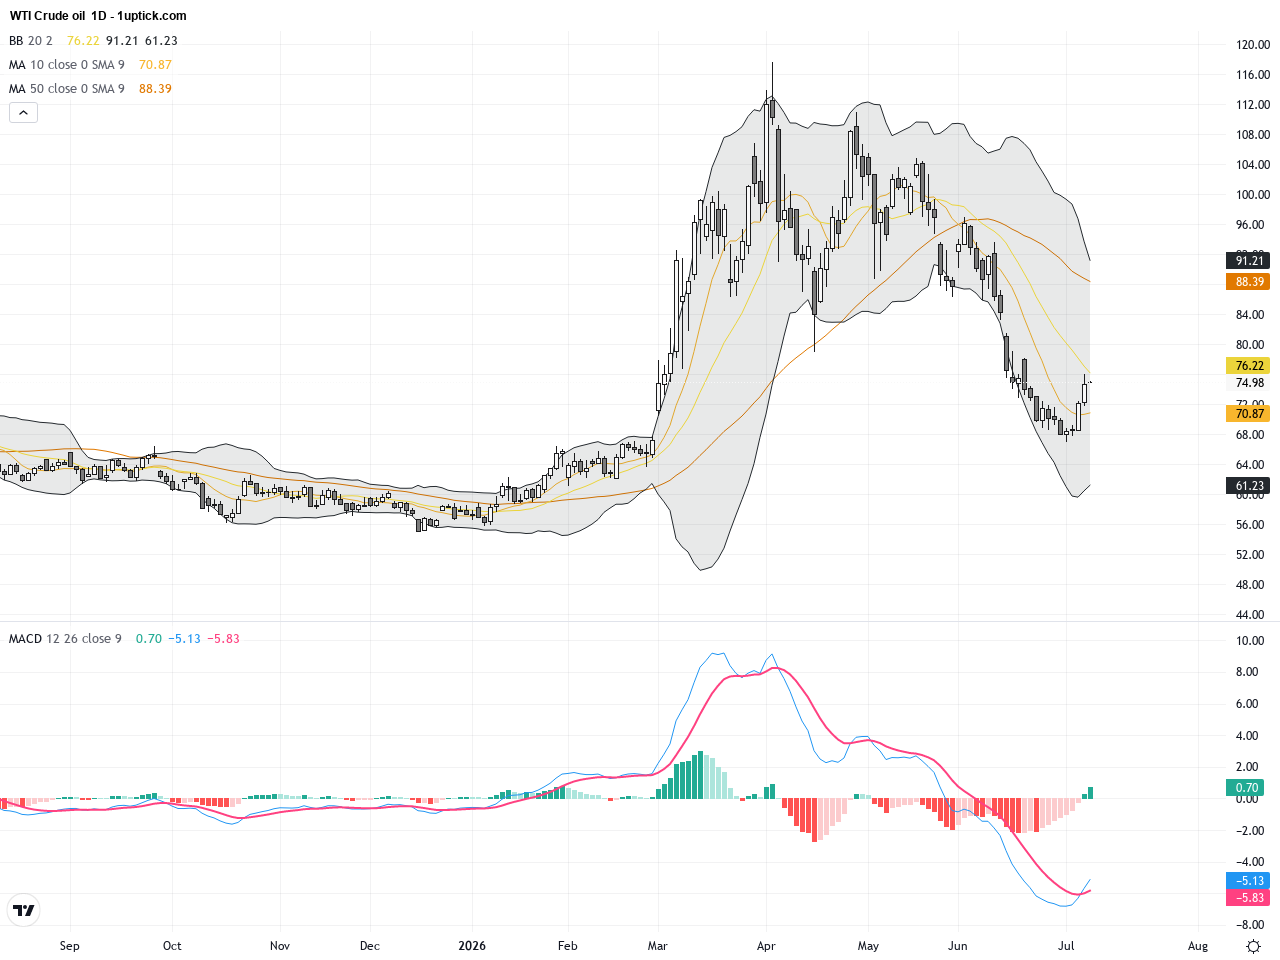
WTI crude oil has shown significant volatility over the past three trading days, rising from the early July lows near $68 to close at $73.52 on July 8. The surge is primarily driven by escalating geopolitical tensions in the Middle East, specifically renewed US-Iran conflicts, spurring safe-haven demand and pushing prices higher. Recent market news highlights a split in energy stocks performance, with Occidental Petroleum rising 4% after an upgrade, reflecting increased investor focus on oil supply disruption risks. For everyday investors, this means opportunities for short-term volatility plays but also heightened risk, underscoring the importance of tracking key support and resistance levels closely.