 |
| Gold V.1.3.1 signal Telegram Channel (English) |
Gold double top pattern in progress ! Ready to do deep ?

Gold double top pattern in progress ! Ready to do deep ?
2024-12-28 @ 20:57
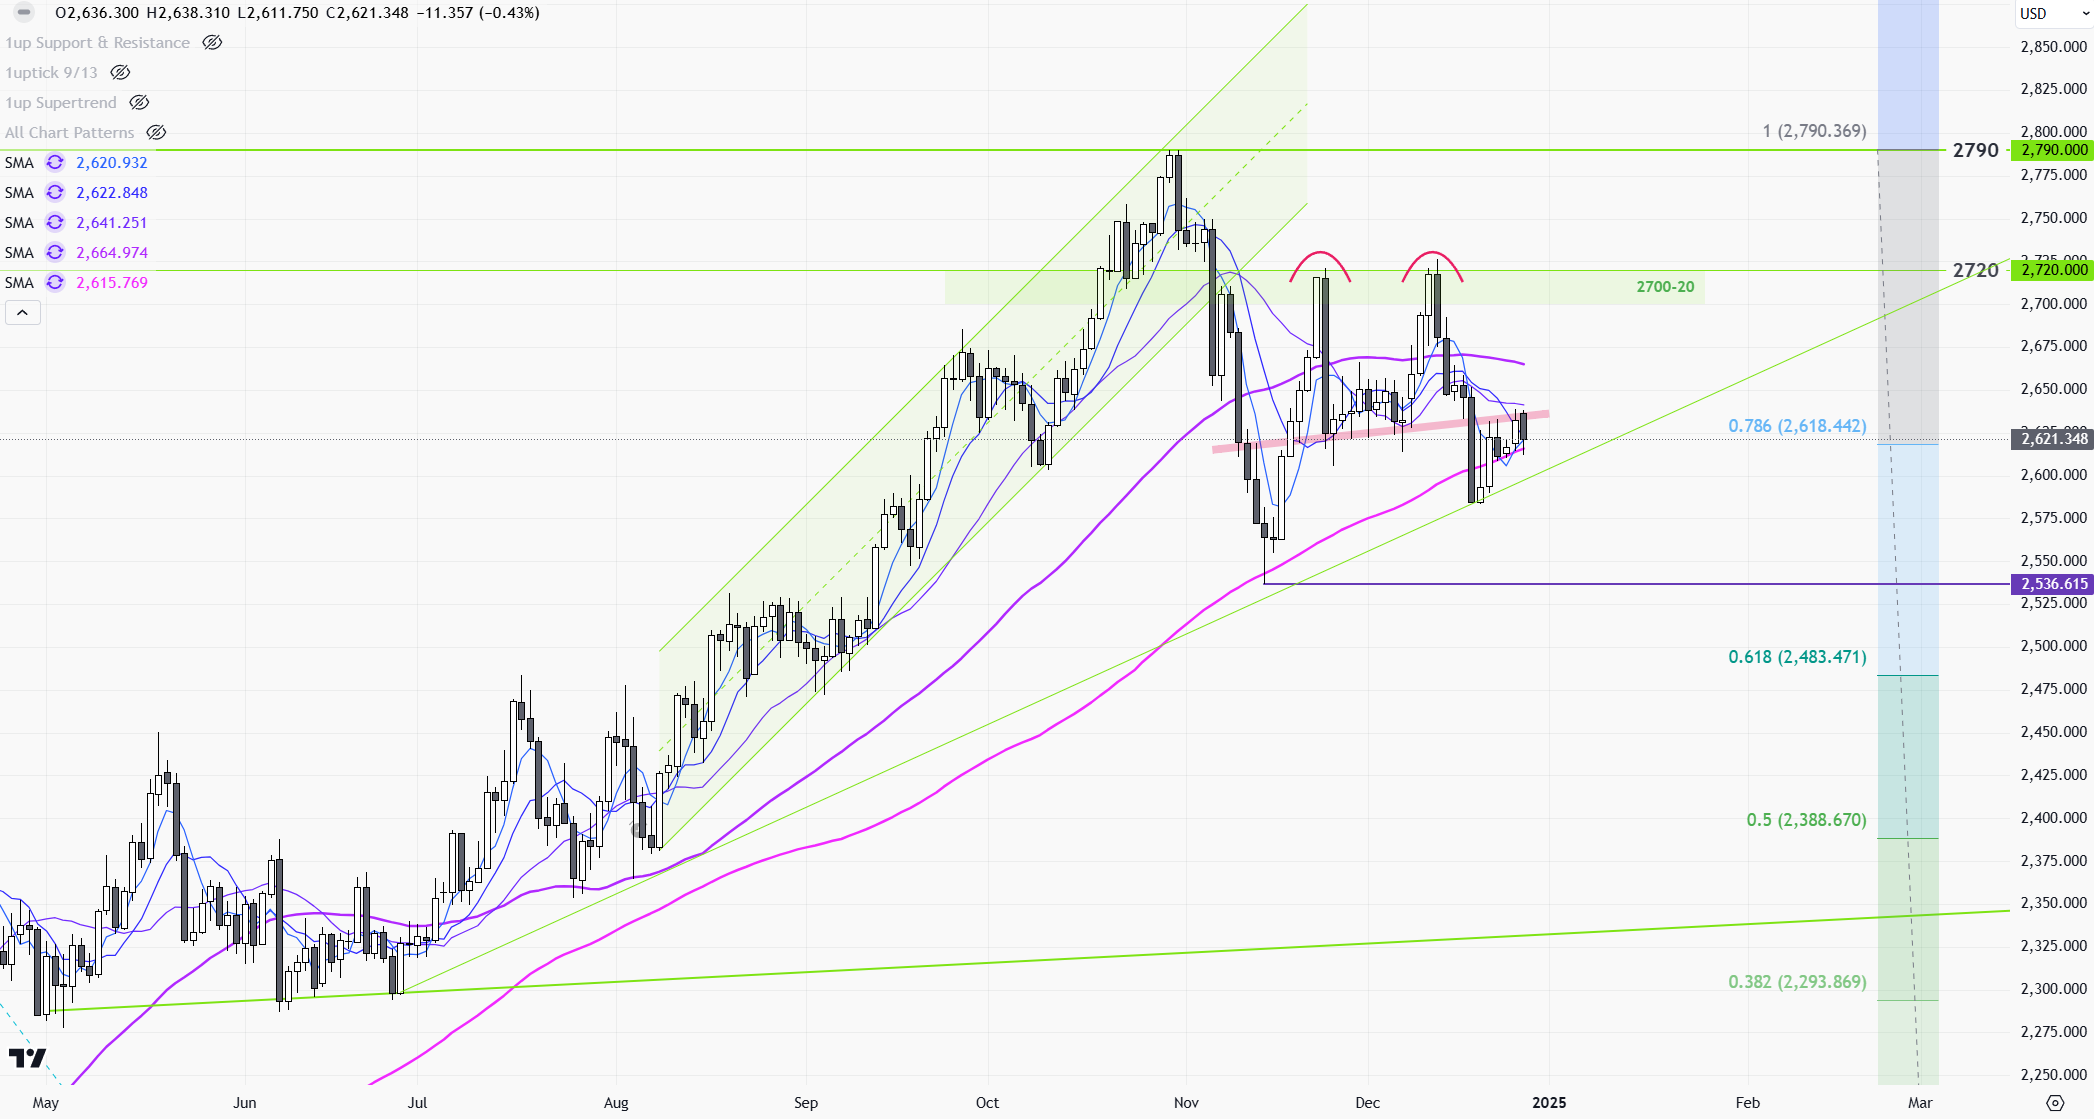
Price Movement
The gold daily chart reveals a significant bullish trend that persisted from May to early November, characterized by a steady rise with minor corrections. The price reached a peak around the 2,790 level, but this was followed by a sharp decline, indicating increased selling pressure. Subsequently, the price has been consolidating, finding support around the 2,618 level, with resistance near 2,720. The recent movement suggests a potential indecision in the market as the price oscillates between support and resistance levels.
Technical Analysis
- Trend Lines: The price broke out of the ascending channel, indicating a potential trend reversal.
- Head and Shoulders Pattern: A bearish reversal pattern is visible, with the neckline around 2,618.
- Moving Averages: The price is currently below the short-term moving averages, suggesting bearish momentum.
- Fibonacci Retracement: Support is aligned with the 0.786 Fibonacci level at 2,618, providing critical support.
- Volume: Decreasing volume during upswings suggests weakening bullish power.
Outlook
The outlook for gold appears cautiously bearish in the short term given the breakdown from the ascending channel and the formation of a head and shoulders pattern. The strong support at the 0.786 Fibonacci level (2,618) will be crucial for determining future movements. If the price sustains below this support, more downside towards 2,536 or lower could be expected. However, a breakout above the 2,720 resistance might signal a recovery and continuation of the prior bullish trend. Investors should closely monitor support and resistance interactions to gauge potential market directions.


