USD at 1 year high!

Home  USD at 1 year high!


USD at 1 year high!

2024-12-30 @ 00:05

Price Movement

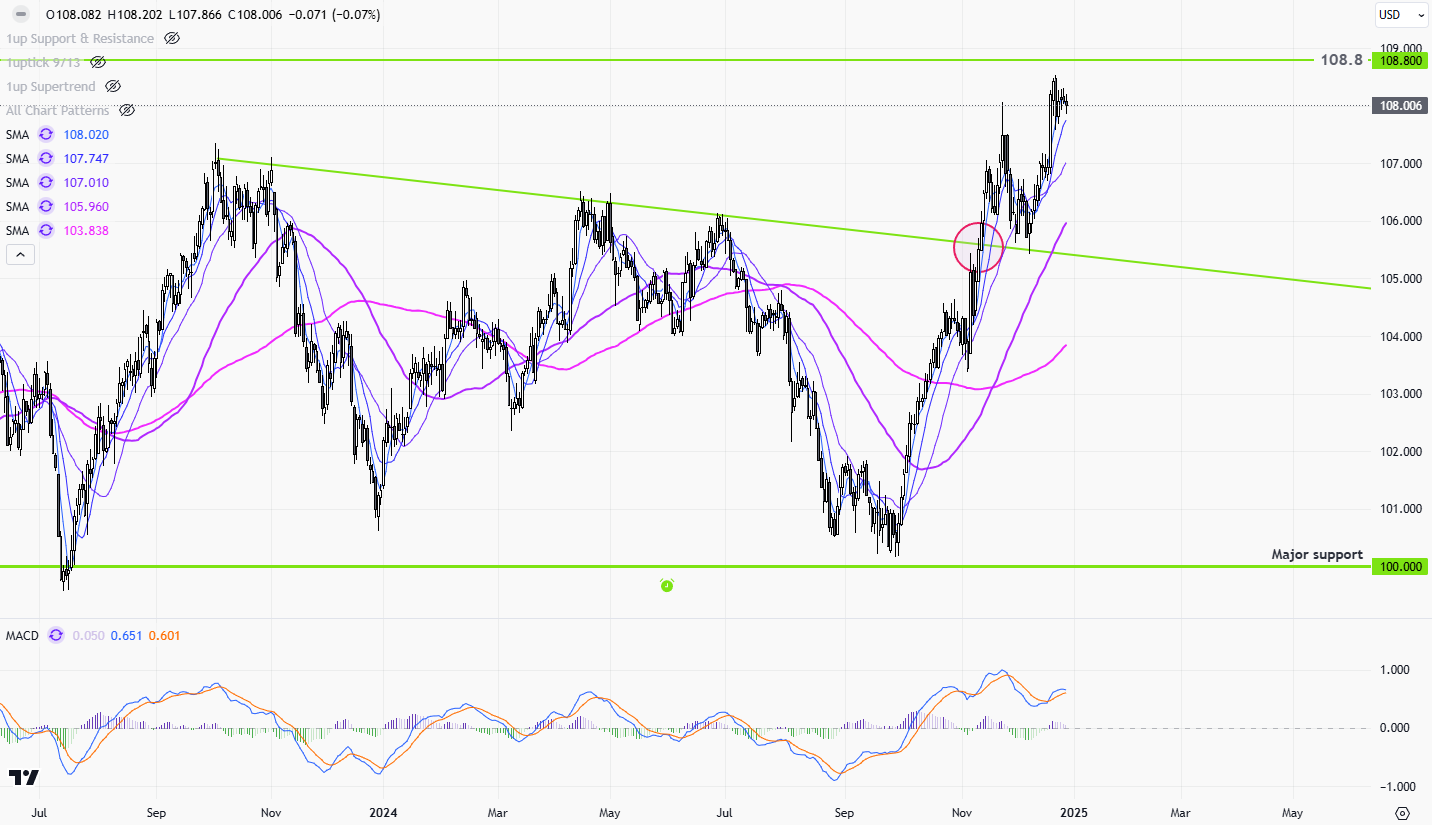
The USD daily chart showcases a significant upward trend in recent months, with the price breaking through a long-standing resistance level. Early fluctuations were contained within a range between 100 and 108, but recent bullish momentum has pushed the price above the 108 mark, indicating strong buying interest. The moving averages have aligned positively, offering additional support to the trend. This breakout suggests a potential shift in market sentiment, as buyers gain control over the price, hinting at further upward potential. The price movements demonstrate increasing volatility and volume, supporting the overall bullish outlook.

Technical Analysis

  • Bullish breakout: Price moves above the key resistance level at 108.
  • Moving Averages (SMA): 50, 100, and 200-day SMAs show upward momentum.
  • MACD Indicator: Shows bullish crossover, confirming buying strength.
  • Volume: Increased volume on breakout days, signaling strong market interest.
  • Trendline: Breaking above downward trendline with conviction.
  • Outlook

    The overall outlook for USD appears bullish, supported by the recent breakout above a critical resistance level at 108. The convergence of moving averages and supportive indicators like the MACD and volume further reinforce this bullish sentiment. The breach of the longstanding downward trendline marks a pivotal moment, suggesting a shift in market dynamics. Investors should remain cautiously optimistic, as the price could encounter resistance near the 108.80 level. Continued monitoring of volatility and market reactions will be crucial to identify any potential reversals or corrections in this prevailing trend.

    Support and Resistance

    Support Level Resistance Level
    105.00 108.00
    102.00 108.80
    100.00 110.00

    Tag:
    Latest Chart Pattern
    GBPUSD 1d

    GBPUSD 1d

    HGc1 1d

    HGc1 1d

    USDJPY 1h

    USDJPY 1h

    1 2 3 14

    1uptick Analytics @

    Maximize your profit at ease

    Risk Warning​

    *Investment involves risk. You may use the information, strategies and trading signals on this website for academic and reference purposes at your own discretion. 1uptick cannot and does not guarantee that any current or future buy or sell comments and messages posted on this website/app will be profitable. Past performance is not necessarily indicative of future performance. It is impossible for 1uptick to make such guarantees and users should not make such assumptions. Readers should seek independent professional advice before executing a transaction. 1uptick will not solicit any subscribers or visitors to execute any transactions, and you are responsible for all executed transactions.

    © 2022-25 – 1uptick Analytics all rights reserved.


    Risk Warning​

    *Investment involves risk. You may use the information, strategies and trading signals on this website for academic and reference purposes at your own discretion. 1uptick cannot and does not guarantee that any current or future buy or sell comments and messages posted on this website/app will be profitable. Past performance is not necessarily indicative of future performance. It is impossible for 1uptick to make such guarantees and users should not make such assumptions. Readers should seek independent professional advice before executing a transaction. 1uptick will not solicit any subscribers or visitors to execute any transactions, and you are responsible for all executed transactions.

    © 1uptick Analytics all rights reserved.

    Home
    Analysis
    Calendar
    Tools
    Signals