


 |
| Gold V.1.3.1 signal Telegram Channel (English) |
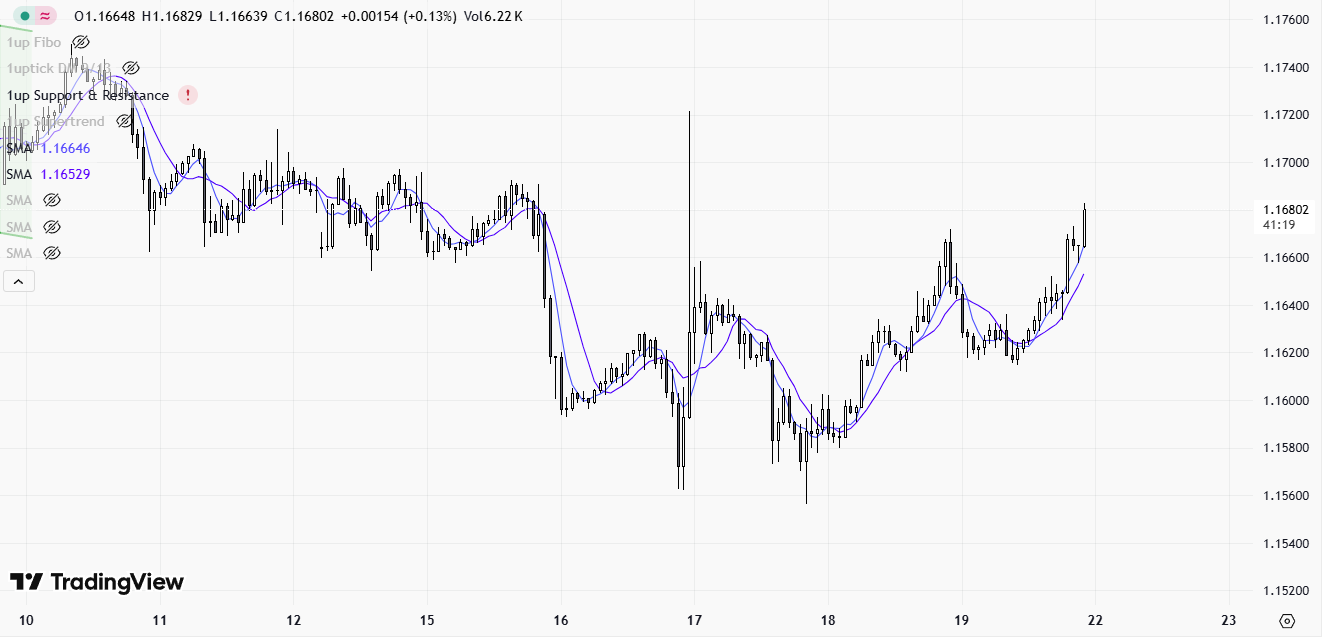
EURUSD-1 hour
2025-07-21 @ 22:29
Market Overview
EURUSD saw notable volatility over the past week, dropping from highs near 1.1826 to lows around 1.1689. The pullback was driven by profit-taking after recent gains and anticipation of key US inflation data. Technical indicators like RSI and MACD leaned bearish, signaling corrective pressure. Despite the correction, medium-term sentiment remained cautious due to prevailing eurozone economic concerns and persistent US dollar strength, as the Dollar Index (DXY) sustained support above 97.70. The break of channel support reinforced short-term weakness, with traders eyeing the 1.1580–1.1720 price range for potential moves. Broader factors impacting movement included shifting US monetary policy expectations, political developments, and investors’ reluctance to aggressively buy the US dollar, helping to contain further downside for the euro.
As of July 21, 2025, a close inspection of the EUR/USD 1-hour candlestick chart reveals several noteworthy technical dynamics that professional traders and investors should consider.
Current Technical Indicators and Signals
Moving Averages: The price action is currently oscillating around a flat 20-period EMA (Exponential Moving Average), while the 50-period SMA (Simple Moving Average) sits just above, indicating a lack of strong directional bias. The proximity of price to these moving averages suggests a phase of equilibrium between bulls and bears.
RSI (Relative Strength Index): The RSI is hovering around the mid-line (45–55), reflecting neither overbought nor oversold conditions. This neutrality in momentum aligns with the recent sideways price action.
MACD (Moving Average Convergence Divergence): The MACD line and signal line are closely intertwined near the zero line, with minimal histogram activity. This signals a lack of strong momentum in either direction and supports the view of consolidation.
Bollinger Bands: The bands have begun to contract after a period of expansion, a classic sign of declining volatility and the potential for a significant breakout following this compression. Price is currently trading near the middle band, reinforcing the neutral short-term outlook.
Chart Pattern Identification
There are no clear, classical reversal patterns such as head and shoulders or double tops/bottoms visible on this chart. However, the recent price action has formed a tightening range, suggesting the formation of a symmetrical triangle or a rectangle pattern. These patterns typically precede a decisive breakout—upward or downward—depending on which side of the consolidation is breached.
Candlestick Pattern Recognition
Recent Candlesticks: The last several candles show small bodies with relatively equal upper and lower wicks, indicative of indecision among market participants. A notable doji appeared at a recent swing low, hinting at potential exhaustion of selling pressure, but the lack of follow-through limits its bullish implications.
Engulfing Patterns: There are no significant bullish or bearish engulfing patterns visible in the immediate vicinity. The absence of strong reversal candlestick signals further underscores the current neutral bias.
Trend Assessment
Current Trend Direction: The broader context suggests a mild downtrend from the weekly highs, but on the 1-hour chart, EUR/USD is best described as consolidating within a narrowing range. The market lacks a clear trend, trading sideways with a slight bearish tilt in the larger timeframes.
Key Support and Resistance Levels
Major Support Zones:
– 1.1580–1.1600: Recent swing lows and psychological round number support.
– 1.1520: Next significant support, as highlighted by previous technical forecasts; a break below here could accelerate downward momentum.
– 1.1440: Stronger, longer-term support, likely to attract buyers if tested.
Major Resistance Zones:
– 1.1670–1.1680: Immediate overhead resistance, aligned with recent highs and the upper boundary of the consolidation range.
– 1.1730–1.1750: A more formidable barrier; reclaiming this zone would signal a potential trend reversal to the upside.
– 1.1800: Major psychological and technical resistance, unlikely to be challenged in the near term without a fundamental catalyst.
Additional Technical Insights
Volume Trends: Volume has tapered off during the consolidation phase, a typical behavior before a breakout. A surge in volume accompanying a breakout from the current range would provide confirmation of the new direction.
Momentum: Momentum indicators (RSI, MACD) are largely flat, with no strong divergence suggesting an imminent reversal. Until a clear breakout occurs, momentum is likely to remain subdued.
External Factors: Market sentiment remains cautious due to ongoing US-EU trade tensions and shifting Fed rate expectations. Any significant news on tariffs or central bank policy could trigger the next directional move.
Actionable Technical Outlook Summary
EUR/USD is currently range-bound between 1.1580 and 1.1680 on the 1-hour chart, with contracting Bollinger Bands signaling a potential breakout imminently. Technical indicators are neutral, and there are no strong reversal patterns at this stage. The path of least resistance remains unclear, but a break above 1.1680 could target 1.1730–1.1750, while a drop below 1.1580 opens the door to 1.1520 and potentially 1.1440. Until a breakout is confirmed, traders are advised to remain cautious, using tight stops and awaiting a clear signal with supporting volume before committing to a directional trade. A neutral-to-bearish bias prevails in the larger context, but the immediate outlook is one of consolidation awaiting a catalyst.