


 |
| Gold V.1.3.1 signal Telegram Channel (English) |
XAUUSD-4 hours
2025-07-22 @ 16:58
Market Overview
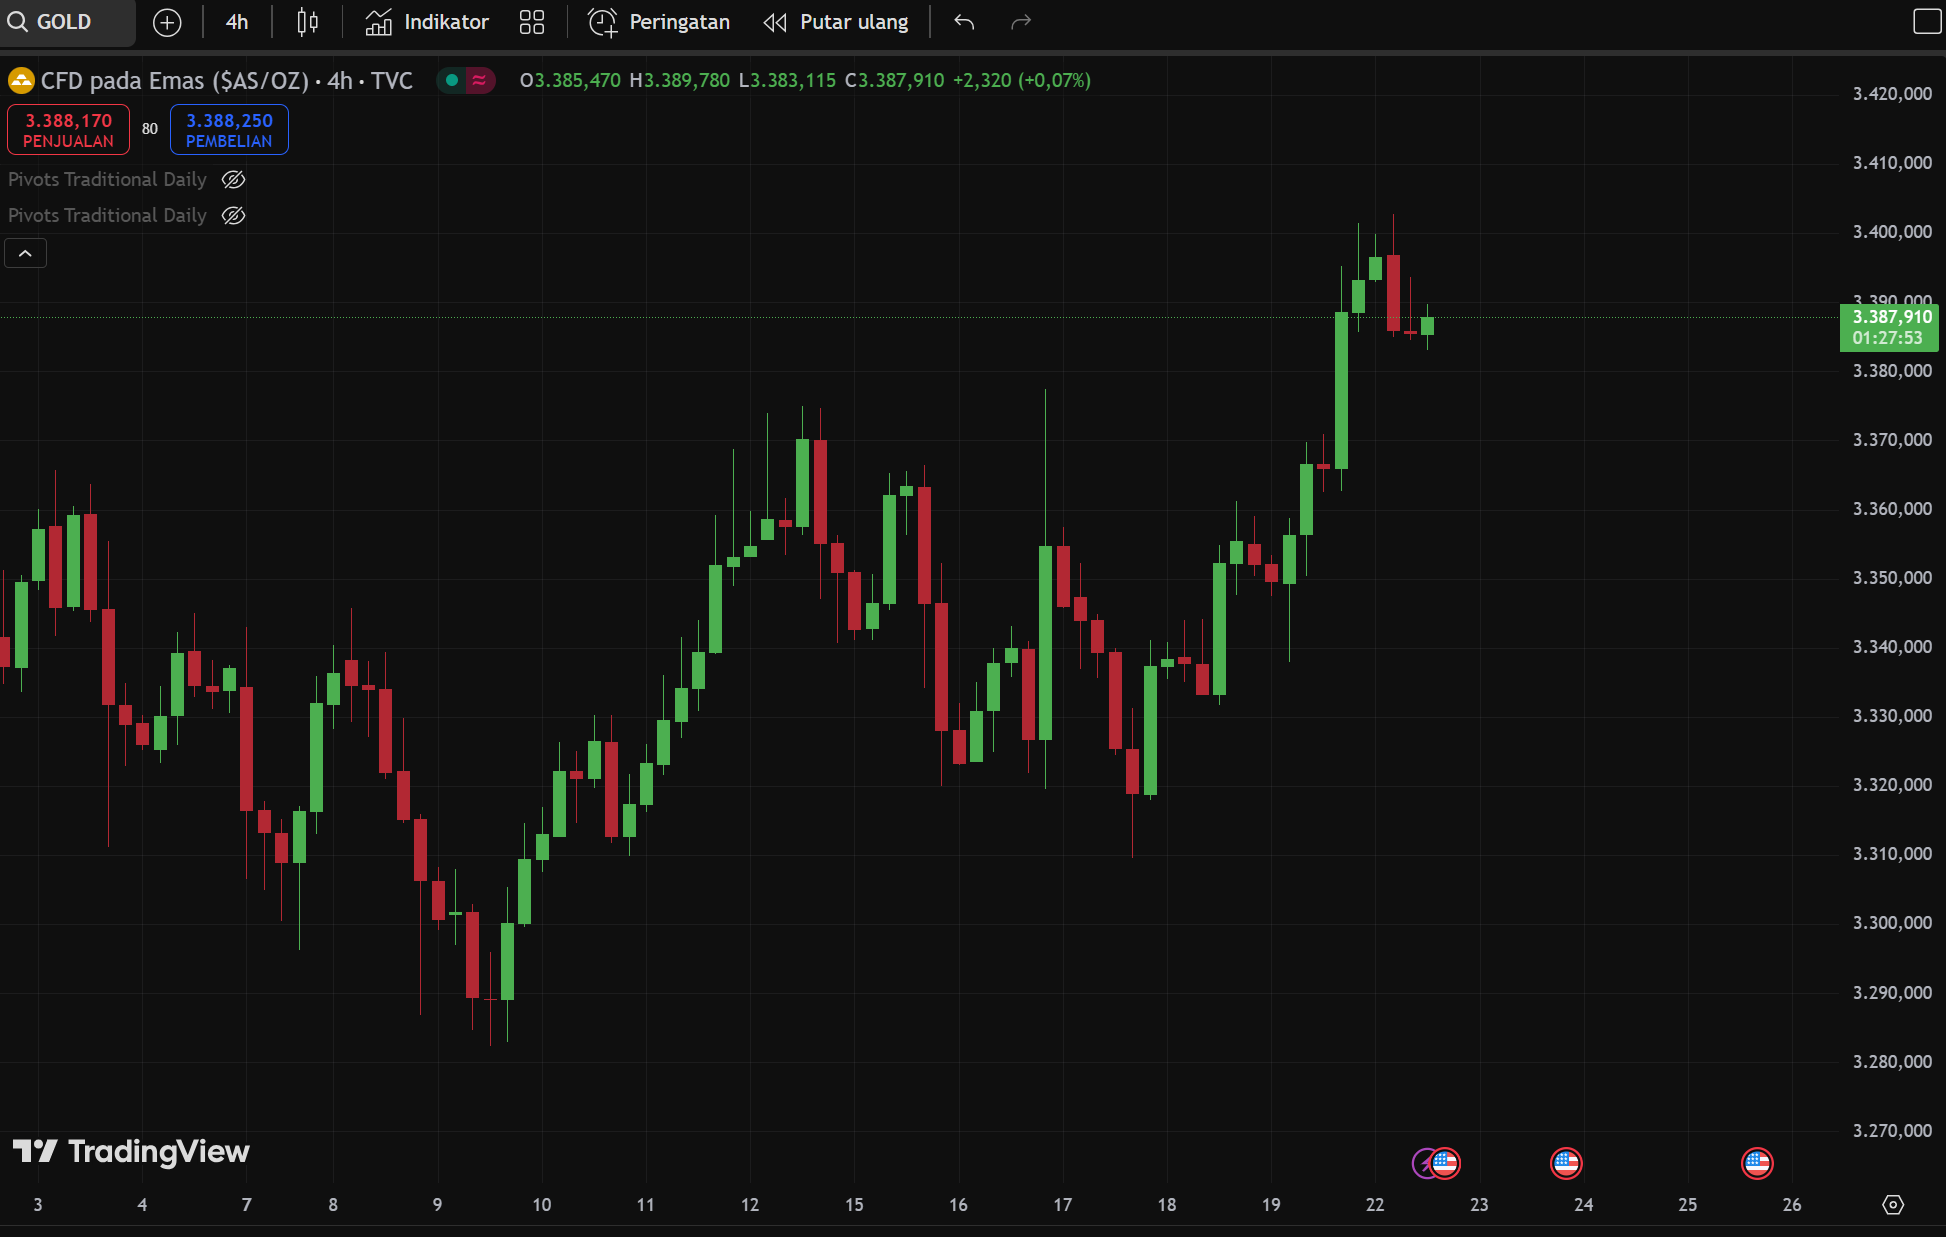
Gold (XAUUSD) has seen consolidation over the past week, with prices fluctuating near $3,390 per ounce after reaching a recent high of $3,452 last month. Price action has remained within an ascending channel, reflecting sustained bullish momentum but also technical pullbacks from the $3,400 resistance. The main drivers behind recent volatility are anticipation around upcoming Federal Reserve commentary on interest rates and uncertainty linked to potential new US tariffs on European imports. These factors have heightened market caution, leading investors to seek gold as a safer asset while awaiting clarity on monetary policy and international trade negotiations. Technical indicators, such as the Relative Strength Index remaining above 50, reinforce gold’s underlying bullish bias, with immediate support seen near $3,358 and prospects for renewed upside if resistance levels are breached.
XAUUSD 4-Hour Chart Technical Analysis (as of July 22, 2025)
Current Technical Indicators and Signals:
– Moving Averages: While the screenshot does not explicitly display moving averages, XAUUSD is currently trading above the recent consolidation pivot (3344), which often coincides with a short-term moving average. This supports ongoing bullish momentum.
– Bollinger Bands: Prices recently touched the lower Bollinger Band and swiftly rebounded, indicating a key support test. A Hammer reversal candlestick formed at the band, historically a bullish signal when found after a decline. Price has since moved closer to the median/upper band, showing renewed upward momentum.
– RSI and MACD: Not directly visible; however, the momentum from the Hammer and price rally suggests the RSI is moving higher, possibly trending toward overbought territory. MACD is likely bullish, reflecting the recent upswing.
Prominent Chart Patterns:
– Ascending Channel: Price continues to oscillate within an upward sloping channel, respecting higher lows and higher highs—a classic sign of an uptrend.
– Triangle Pattern: Recent price action highlights the completion of a triangle formation. The upper and lower trendlines have each been tested three times, with price action nearing the triangle’s apex. Such patterns often precede breakouts or reversals.
Recognized Candlestick Patterns:
– Hammer: A clear Hammer reversal pattern appeared near $3,319 (the lower Bollinger Band and notable support), indicating strong buying interest and the start of a bullish wave.
– Potential Doji/Small-body Candles: Multiple small-bodied candles appear after the upward impulse, reflecting a phase of short-term indecision or consolidation, often typical before a new directional move.
Trend Direction:
– The immediate trend is bullish, underpinned by higher lows, a sequence of ascending candles post-reversal, and ongoing movement within an ascending channel. There is, however, evidence of choppiness and local resistance capping advances, which is typical near triangle pattern resolutions and major resistance zones.
Major Support and Resistance Levels:
– Support:
– $3,319: Recent swing low and site of the Hammer pattern, signifying a robust demand zone.
– $3,340–$3,344: Pivot and central price envelope, as well as former consolidation base.
– Resistance:
– $3,380: Upper end of current consolidation range and a key static level.
– $3,384: Immediate upside target following a breakout.
– $3,415: Medium-term resistance and target for bullish expansion.
– $3,430: Next major resistance if bullish momentum accelerates.
Other Insights (Volume, Momentum, Market Context):
– Although the chart doesn’t display volume, the sharp Hammer rebound and upward continuation typically attract increased trading activity, signaling a shift in momentum.
– The triangle pattern nearing completion suggests a breakout is imminent, with the likelihood of a volatile move in line with the prior trend’s direction (upward).
– Market context remains supportive for gold: a weaker USD and dovish Fed rhetoric underpin the bullish technical scenario.
Actionable Summary:
Gold (XAUUSD) on the 4-hour chart demonstrates a resilient bullish structure, confirmed by a Hammer reversal off support, an ascending price channel, and a nearly resolved triangle pattern—often a precursor to a strong breakout. Key resistance sits at $3,380–$3,384, followed by $3,415. Strong support persists around $3,319 and $3,340. The trend remains bullish unless price convincingly breaks below $3,319, at which point a deeper correction could unfold. Until then, the technical setup favors buying dips toward support, with profit targets at the next resistance zones. Traders should monitor for triangle resolution and any momentum acceleration, especially around the $3,380–$3,384 band.