![[Daily Closing 🔔] Gold – Gold Prices Slide as Investors Cash Out After U.S.-China Tariff Deal](https://int.1uptick.com/wp-content/uploads/2025/05/2025-05-13T004619.999Z-file-1024x683.jpeg)
![[Daily Closing 🔔] Gold – Gold Price Outlook and Technical Analysis: Key Reasons Behind the Recent Decline and Support Levels](https://int.1uptick.com/wp-content/uploads/2025/05/2025-05-09T043547.401Z-file-1024x576.png)
 |
| Gold V.1.3.1 signal Telegram Channel (English) |
CLc1-Daily
2025-07-18 @ 11:33
Market Overview
CLc1 crude oil futures saw moderate price fluctuation over the past week, with WTI crude trading between $67.5 and $67.7 per barrel. The market experienced downward pressure primarily due to concerns over global economic growth, persistent high inflation, and elevated interest rates, which have dampened manufacturing and industrial demand. Additionally, uncertainty regarding US trade policy following the recent presidential administration change and ongoing US-China tensions contributed to cautious market sentiment. On the supply side, an anticipated recovery in ex-China demand has yet to materialize, while China’s economic momentum remains fragile in the face of its property sector downturn. These factors combined kept oil prices rangebound, reflecting a balance between geopolitical and macroeconomic risks.
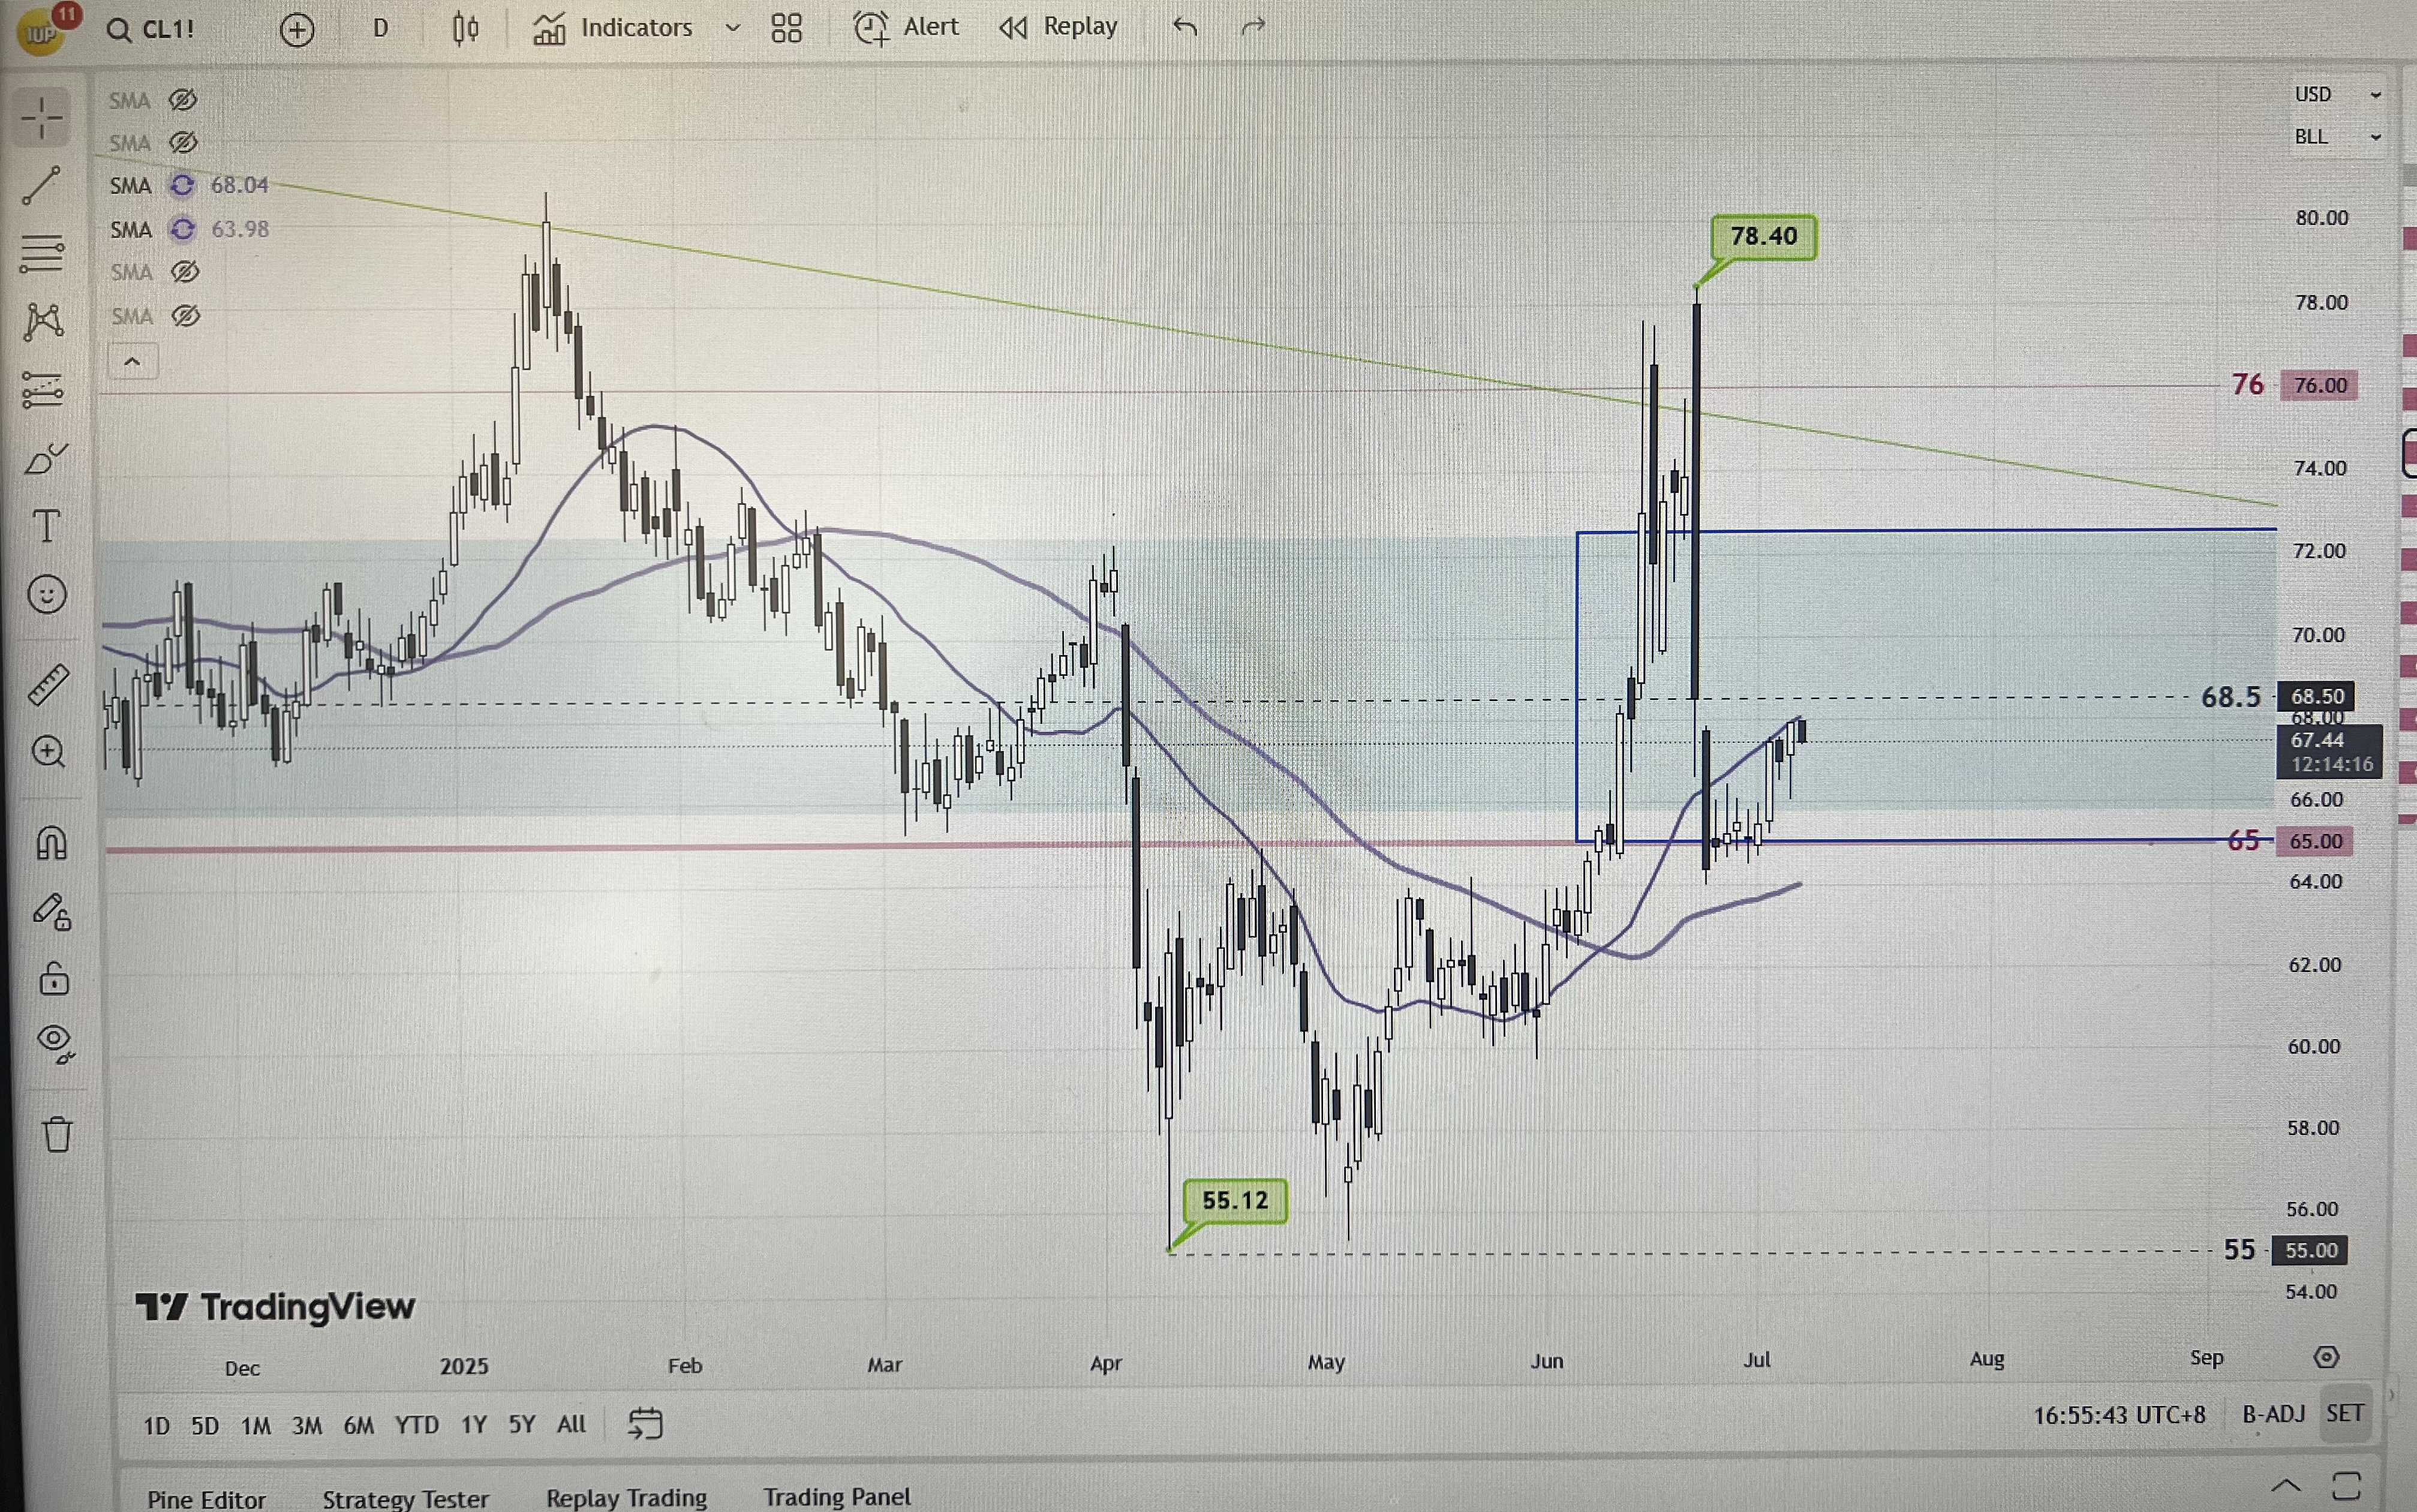
WTI Crude Oil (CLc1) Daily Chart Technical Analysis – July 18, 2025
Current Technical Indicators:
- Moving Averages: Price is currently sitting just above multi-month support at $68, slightly below the 200-day moving average (around $68.40), with the 50-day moving average at approximately $64.23. Price movement is confined between these two key moving averages, indicating a technical squeeze and setting up for a potential breakout or breakdown.
- Relative Strength Index (RSI): The RSI is neutral around 44–45, suggesting neither overbought nor oversold conditions and reinforcing a sideways bias.
- MACD (Moving Average Convergence Divergence): The MACD remains negative, indicating downward momentum still lingers, though it could be at risk of turning if price regains strength above resistance.
- ADX (Average Directional Index): An ADX reading below 20–25 indicates a lack of clear trend and favors range trading strategies over trend following for now.
- Stochastic Oscillator: High recent readings suggest upward attempts but risk of overextension remains if fresh demand fails to emerge.
Prominent Chart Patterns:
- No classical reversal patterns (such as head and shoulders or double tops/bottoms) are apparent in the current range-bound structure.
- Price is consolidating in a broad rectangle between $66 and $70, forming a well-defined range that could serve as the base for a larger breakout.
- The series of wicks and rejection tails near $66 highlight the significance of this support, while failed rallies above $75 illustrate robust resistance.
Candlestick Patterns:
- Recent sessions feature long lower shadows (wicks) near the $66–$68 area, which is characteristic of a buying tail and implies demand defending this zone.
- No clear bullish engulfing or hammer patterns are currently dominant, but presence of multiple doji-like candles signals market indecision at these levels.
Trend Direction Assessment:
- Market action over the past month suggests a sideways consolidation between $66 and $70, lacking a decisive trend as price oscillates within this zone.
- Despite a failed breakout above $75 earlier in July, the fact that price did not drop below $66 is a constructive sign for bulls, but until a breakout above $70 is confirmed, range trading persists.
Major Support and Resistance Levels:
- Key Support: $66.00–$68.00, a well-tested zone dating back to late 2023 and reinforced by multiple recent rebounds.
- Immediate Resistance: 200-day moving average near $68.40.
- Upper Resistance: $72.00–$76.00, the site of repeated rejection during recent attempted breakouts.
- Range Extremes: $66 (bottom), $70 (top boundary), serving as tactical inflection points.
Additional Technical Insights:
- Volume: No dramatic volume spikes are seen; relatively flat volume in rangebound markets suggests neither bulls nor bears have asserted dominant control.
- Momentum Shifts: Negative momentum remains but is waning as price stabilizes above key support, indicating potential for mean reversion or an attempt to retest overhead resistances.
- Open Interest: Declining open interest in recent sessions suggests that trend conviction is low and many traders are closing positions, favoring a consolidation scenario.
Actionable Technical Outlook:
WTI crude oil (CLc1) is currently locked in a broad consolidation between $66 and $70, with technical signals favoring patience and rangebound trading strategies. Bulls retain the advantage above the $66–$68 support, but conviction is lacking until price demonstrates sustained closes above the 200-day moving average and the $70 pivot. Below $66, trend-following shorts could regain momentum. For now, disciplined range trading within clearly identified boundaries, with tight risk controls, is warranted pending a decisive breakout or breakdown.
Latest Technical Analysis
![[Daily Closing 🔔] Gold – Gold Prices Slip on Monday Amid Improved US-China Trade Sentiment – Market Analysis for May 13, 2025](https://int.1uptick.com/wp-content/uploads/2025/05/2025-05-20T224010.678Z-file-1024x576.png)