


 |
| Gold V.1.3.1 signal Telegram Channel (English) |
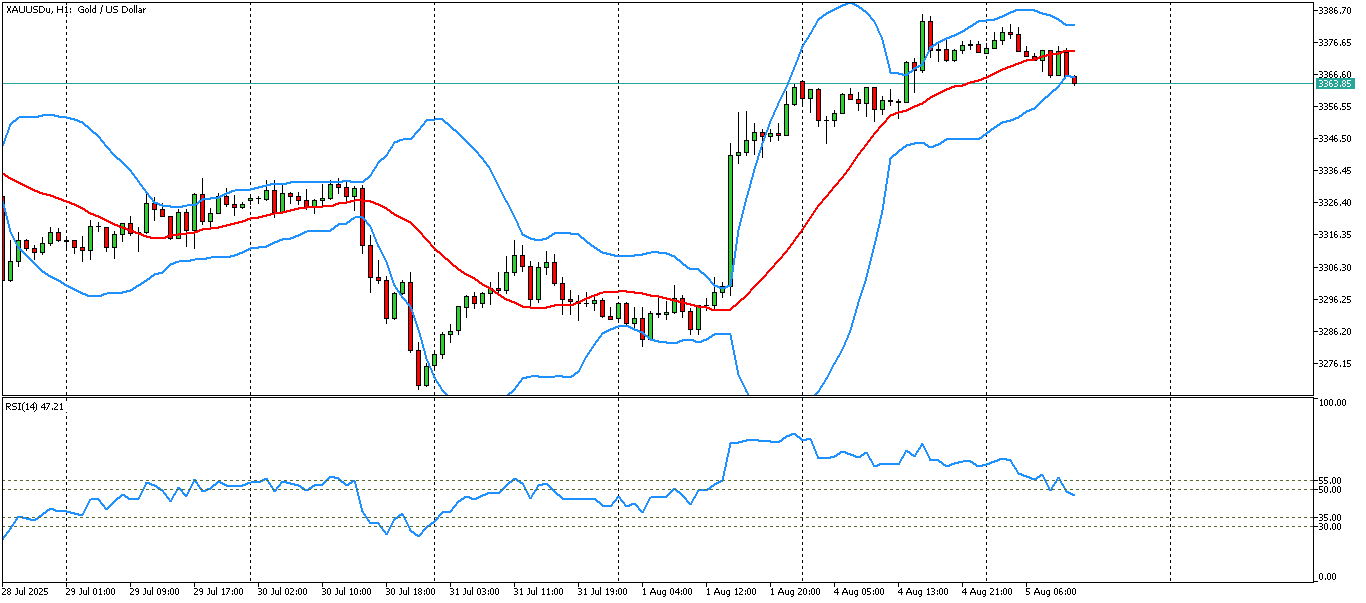
XAUUSD-1 hour
2025-08-05 @ 17:36
Market Overview
Gold (XAUUSD) has exhibited significant volatility over the past week, initially dropping from the $3,435 area to a low near $3,270 after breaking below a technical triangle pattern. This marked a one-month low, reflecting the market’s reaction to July’s bearish monthly close and a shift in momentum between buyers and sellers. However, demand for gold was revived midweek following weaker-than-expected US labor data and the announcement of broad new US trade tariffs, which increased safe-haven demand. Gold bounced sharply from support at $3,267 and regained ground to trade around $3,358 by August 5. Key drivers included heightened geopolitical uncertainty, prospects of a US Federal Reserve rate cut in response to economic softness, and technical factors such as the 100-day moving average providing support. The market outlook remains cautiously bullish, contingent on sustained risk aversion and further policy developments.
Gold (XAUUSD) on the hourly chart is exhibiting a strong short-term uptrend with signs of heightened volatility. The analysis below summarizes key technical indicators, chart and candlestick patterns, trend direction, support and resistance levels, and relevant trading insights as of the latest available chart image (1H with Bollinger Bands).
Technical Indicators and Signals
– Bollinger Bands: Price is trading near the upper range of the Bollinger Bands, indicating recent bullish momentum and suggesting short-term overbought conditions. The upper band widening signals increasing volatility and the potential for sharp price moves.
– No explicit moving averages, RSI, or MACD are visible on the attached chart; however, the strong trend towards the upper band typically aligns with prices being above short-term moving averages and bullish momentum.
– Volume data is not visible on the chart, but external sources report low volume, indicating the current move may lack strong institutional participation—which can increase the risk of volatility and sharp corrections.
Chart Patterns
– The overall price action forms a clear uptrend with a series of higher highs and higher lows.
– There is no classical head and shoulders, double top/bottom, or clear triangle pattern visible in the recent structure.
– Consolidation is occurring after a strong rally, which could suggest the formation of a bullish continuation pattern if the upper resistance is broken decisively.
Candlestick Patterns
– Recent candlesticks near the upper Bollinger Band suggest buying pressure with minor retracements. While the chart does not specifically highlight individual candle patterns such as dojis or hammers, some wicks to the downside within the consolidation zone indicate buyer support on dips.
– No explicit bearish reversal patterns (e.g., bearish engulfing) are visible at resistance, which leaves the uptrend intact for now.
Trend Direction
– The prevailing direction is upward, as evidenced by strong movements along the upper Bollinger Band and a lack of significant bearish reversals. The trend since the end of July has remained bullish on the 1-hour timeframe.
Support and Resistance Levels
– Immediate resistance is found at the 3,373 zone. A breakout and close above this level would open up the path for further advance towards the July high near 3,439.
– First support is at 3,358–3,344 from recent swing lows and mid-band Bollinger support. If this level gives way, further support resides in the 3,325–3,300 region, aligning with the previous structure and likely areas of renewed buying interest.
– An intraday support level at 3,314.85 has been noted as critical. A decisive break below this would put the uptrend in jeopardy, shifting bias towards correction.
Other Technical Insights
– Momentum is strong but may be at risk of near-term exhaustion if price continues to hug the upper Bollinger Band with low volume.
– The consolidation just below resistance suggests that bulls are pausing, awaiting a catalyst for the next move. Any significant uptick in volume or a strong impulse candle above resistance would likely attract breakout traders and further momentum buying.
– Watching for bearish pullbacks down to support levels could offer buying opportunities in line with the uptrend, provided key supports hold.
Actionable Technical Outlook Summary
Gold (XAUUSD) remains in a strong intraday uptrend on the 1-hour chart, currently trading near key resistance at 3,373 with rising volatility. Short-term traders should be alert for a confirmed breakout above this level for trend continuation towards 3,439, while also watching for potential pullbacks to 3,344 or 3,325 for possible re-entry points. Bears would only gain traction if price closes decisively below 3,314, shifting focus to deeper corrective targets. Overbought conditions and low volume warrant caution; risk management remains crucial during the next market move.