


 |
| Gold V.1.3.1 signal Telegram Channel (English) |
XAUUSD-1 hour
2025-08-05 @ 17:37
Market Overview
Gold (XAUUSD) traded between $3,267 and $3,373 over the past week, showing high volatility after a sharp 2.2% rally late last week driven by heightened safe-haven demand following new U.S. tariff announcements and weak U.S. labor data. However, the move stalled near $3,358 as technical resistance emerged and profit-taking set in. Despite a bearish monthly candle close in July signaling possible further downside, buyers found support at the 100-day moving average around $3,270. Policy uncertainty, Fed rate cut expectations, and ongoing trade tensions are keeping gold in focus, with the next key levels at $3,244 support and $3,350 resistance.
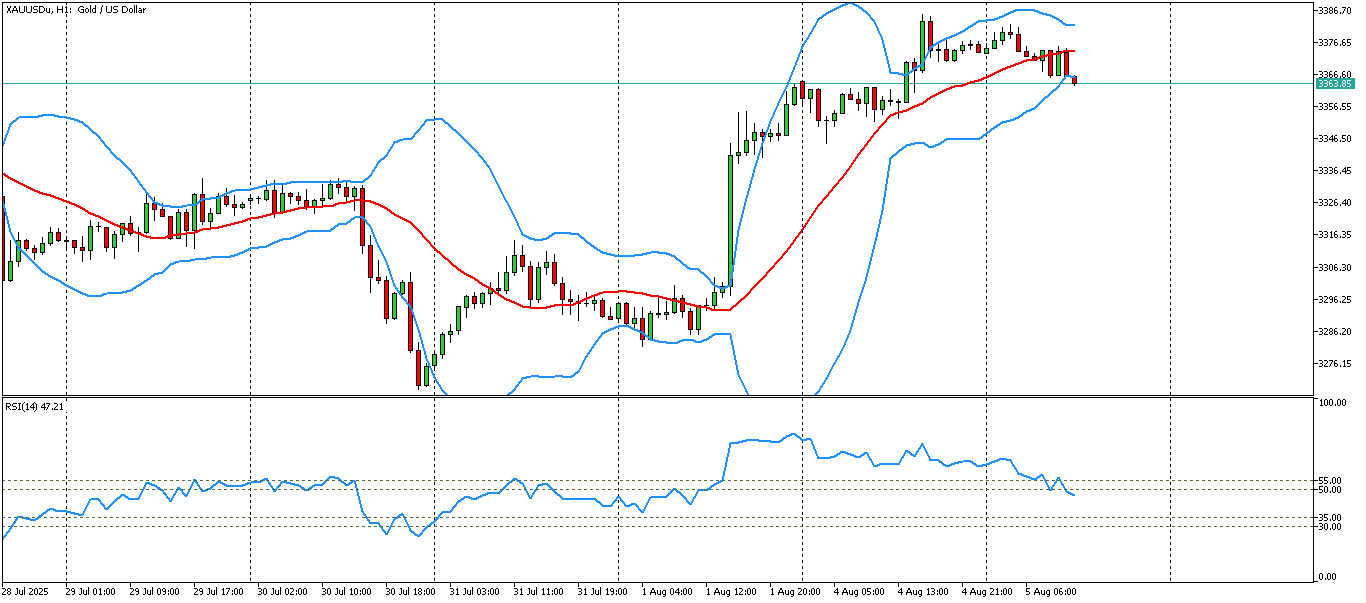
Gold (XAUUSD) 1-hour candlestick chart analysis – August 5, 2025
The 1-hour XAUUSD chart, overlaid with Bollinger Bands, shows gold consolidating near recent highs after an extended rally, but with growing signs of short-term overbought conditions and volatility expansion. Here’s a comprehensive breakdown of its technicals:
Technical Indicators and Signals
– Bollinger Bands: Price is riding the upper band, suggesting overbought momentum and a potential for short-term pullback. The bands are widening, which signals increased volatility; such moves can precede significant directional price shifts.
– Momentum and Volume: There is evidence of low trading volume in the latest consolidation phase, indicating possible exhaustion from buyers and increasing the risk of a retracement if sellers step in. Thin volume near tops often suggests the uptrend is losing conviction.
– Implied Trend Oscillators (RSI/MACD): While not visible on the chart, extended action at the upper Bollinger band strongly implies that oscillators like RSI are near or above overbought thresholds (RSI >70), and momentum signals could start to show divergence if price stalls further.
Chart Patterns and Candlestick Patterns
– No Clean Major Reversal Patterns: The recent price action does not highlight a classic head and shoulders, double top/bottom, or clear triangle pattern. Consolidation at the highs could be described as a range-bound rectangle, a stalling pattern typical ahead of either a breakout or mean-reverting move.
– Prominent Candlestick Signals: In the recent candles near the upper band, there are multiple wicks on both upper and lower sides, with several small-bodied candles resembling dojis and spinning tops. These are classic indecision signals, often preceding either a reversal or a sharp continuation once direction is resolved.
– Engulfing Patterns: No strong bullish or bearish engulfing candles are currently visible, implying a lack of decisive buyer or seller control at this moment.
Trend Assessment
– Direction: The dominant trend since late July has been upward, with higher highs and higher lows leading into this consolidation area. Currently, gold is pausing, entering a sideways phase between two key zones, but the broader trend remains bullish unless key supports break.
– Intraday Structure: The structure is of a stall or potential short-term correction within a larger bullish context. Price is neither in a clean breakout mode nor a full reversal, but rather in a holding pattern.
Support and Resistance Levels
– Immediate Support: 3,344, with next important support at the 3,325–3,300 zone. A drop through 3,344 may prompt further selling towards these lower levels.
– Strong Intraday Support: The 3,314 level is highlighted as pivotal; breaching it decisively would indicate that the uptrend on the 1-hour chart has ended and a deeper correction is likely.
– Current Resistance: 3,358 first, and then 3,373. Sustaining price above 3,373 opens the way toward the July peak at 3,439.
– Short-Term Range: Price is boxed within 3,344 (support) and 3,373 (resistance), with action clustering close to the upper end.
Other Technical Insights
– Consolidation/Compression: Price is compressing after a rally, and traders should be alert for a volatility-driven breakout (up or down) in coming sessions.
– Volatility Watch: Widening Bollinger Bands are a sign of impending larger moves, especially when coupled with narrowing price oscillation within a range.
– Volume Divergence: Fading volume on rallies increases the probability of a short-term retracement unless new buyers step in.
Actionable Technical Outlook
XAUUSD remains in a bullish environment but is showing signs of short-term exhaustion and overextension. Cautious traders will look for a confirmed breakout above 3,373 to reinitiate long positions targeting 3,439. Conversely, a break below 3,344/3,314 opens downside to 3,325 and 3,300. In the near-term, patience is warranted as the market decides at this inflection point; beware of volatility and false breaks during this consolidation phase. Tight risk controls are advisable given the low-volume backdrop and expanding volatility band.