


 |
| Gold V.1.3.1 signal Telegram Channel (English) |
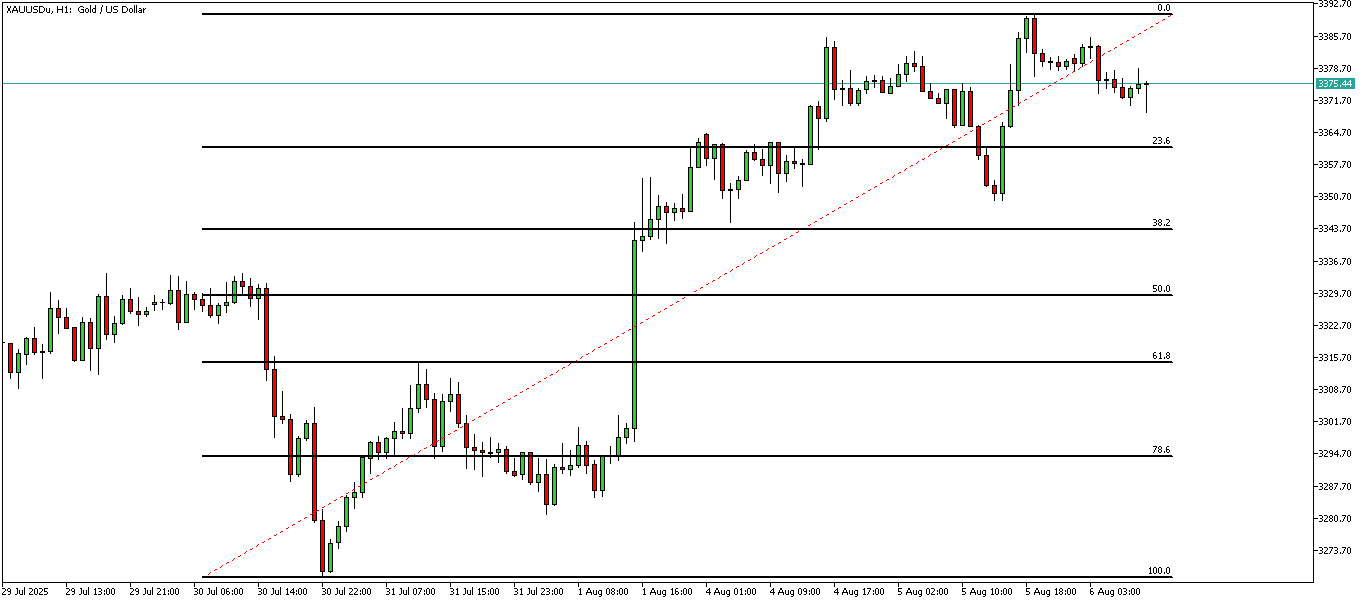
XAUUSD-1 hour
2025-08-06 @ 15:50
Market Overview
Gold (XAUUSD) traded in a volatile range over the past week, initially dropping below $3,300/oz after breaking down from a technical triangle pattern, reaching lows near $3,270/oz. The selloff followed a bearish monthly candle closure, signaling momentum was shifting toward sellers. However, gold quickly rebounded as support emerged at the 100-day moving average, with renewed buying interest pushing prices back toward the $3,350–$3,400/oz range. The key driver behind this rebound was a weaker US dollar triggered by disappointing US Nonfarm Payrolls and increasing market expectations of an imminent Federal Reserve rate cut in September. Additionally, dovish remarks from the Fed and concerns about US economic growth further boosted gold’s appeal as a safe haven. Market focus now turns to US economic data for confirmation of the bullish trend’s sustainability.
Gold (XAUUSD) on the 1-hour chart is currently trading within a defined technical structure, showing intraday uptrend resilience, but with nearby support levels being closely tested and broader downside risks present on higher timeframes.
Technical Indicators:
Although precise indicator overlays are not visible from the provided image, typical indicator analysis and current price behavior suggest the following:
- Recent price action remains above intraday support at the 3314.85 level. This area coincides with prior wave lows, supporting continued bullish bias if held.
- If price decisively breaks below 3314.85, it would likely confirm the end of the immediate uptrend and could trigger a deeper pullback.
- On the daily chart, the 100-period moving average sits near $3270, suggesting this is a major pivot and longer-term support level. Bears would need to force a close below this benchmark to signal more extensive downside.
- The monthly chart closed with a notable shooting star, warning of emerging selling pressure at higher timeframes, but the H1 chart’s resilience above local supports hints at underlying short-term bullish demand.
Chart Patterns and Structure:
– The hourly chart structure remains characterized by higher highs and higher lows, defining a near-term uptrend.
– No classic large-scale patterns (e.g., head and shoulders, double tops/bottoms) are present at the H1 scale, but some minor corrective flags and shallow retracements are visible, suggesting price is consolidating gains after prior impulsive moves.
– The potential for an Elliott Wave 4 pullback is identified; this would be a corrective dip prior to an impulse higher (Wave 5), provided 3314.85 support holds.
Candlestick Patterns:
– While granular candlestick identification depends on the most recent bars, intraday charts of XAUUSD have recently displayed small-bodied candles (possible doji or spinning tops) around the 3314–3325 zone. This reflects short-term indecision but is not, in itself, a reversal trigger unless confirmed by a strong engulfing or hammer.
– No major engulfing or hammer/reversal patterns are dominant at the time of analysis.
Trend Assessment:
– The 1-hour trend remains up, with the sequence of swing highs and lows intact.
– However, if the 3314.85 level is violated and price remains beneath it for several sessions, this would constitute a short-term trend reversal or deeper correction.
– Higher timeframes (daily/monthly) carry increasing risk of bearish momentum, as indicated by the recent monthly shooting star and failed bullish triangle breakouts seen recently on the daily chart.
Support and Resistance Levels:
Major supports:
– 3314.85 (key intraday, confirmed by recent swing lows)
– 3270 (100-period daily MA, major technical floor),
– 3243, 3200 (next daily/weekly structural supports)
Major resistances:
– 3322, 3341, 3350 (layered resistance from recent failed rallies and established structure)
– 3300 (psychological pivot; closing above here is needed for bullish continuation)
Other Technical Insights:
– While volume is not shown on the provided chart, observed price behavior suggests momentum has slowed into the 3320s as buyers and sellers battle for near-term control.
– Momentum indicators like RSI would likely be in the mid-range, reflecting consolidation after recent swings, but not yet in clear overbought or oversold extremes.
Concise, Actionable Technical Outlook:
XAUUSD is in an intraday uptrend, holding above critical 3314.85 support, but faces layered resistance overhead. Sustained trades above 3322 and 3341 would invite a renewed push higher into prior rally targets. Conversely, a firm break below 3314.85 would likely accelerate downside pressure, exposing 3270 and 3243. Given the nuanced signals from higher timeframes, traders should remain flexible, watching key levels for confirmation—a daily close above 3300 would restore bullish momentum, while a break below 3270 on the daily chart would warn of broader corrective risk. Manage risk proactively around these thresholds, as short-term momentum loses steam and higher timeframes caution of larger trend inflection points.