


 |
| Gold V.1.3.1 signal Telegram Channel (English) |
XAUUSD-Daily
2025-08-13 @ 12:04
Market Overview
Gold (XAUUSD) saw robust upward momentum this past week, with prices rising above 3,350 USD and posting gains of over 3 percent. The trend was driven by global economic uncertainty, particularly confusion around new US tariffs on gold imports and continued strong demand from China. Inflation data heightened market caution, with investors watching US CPI figures and favoring gold as a hedge amid modest dollar strength. Technical indicators reflected bullish sentiment, with price action breaking key resistance levels despite some midweek corrections. Safe haven flows remained strong due to ongoing trade war speculation and central bank gold purchases, supporting the outlook for continued gains in the near term.
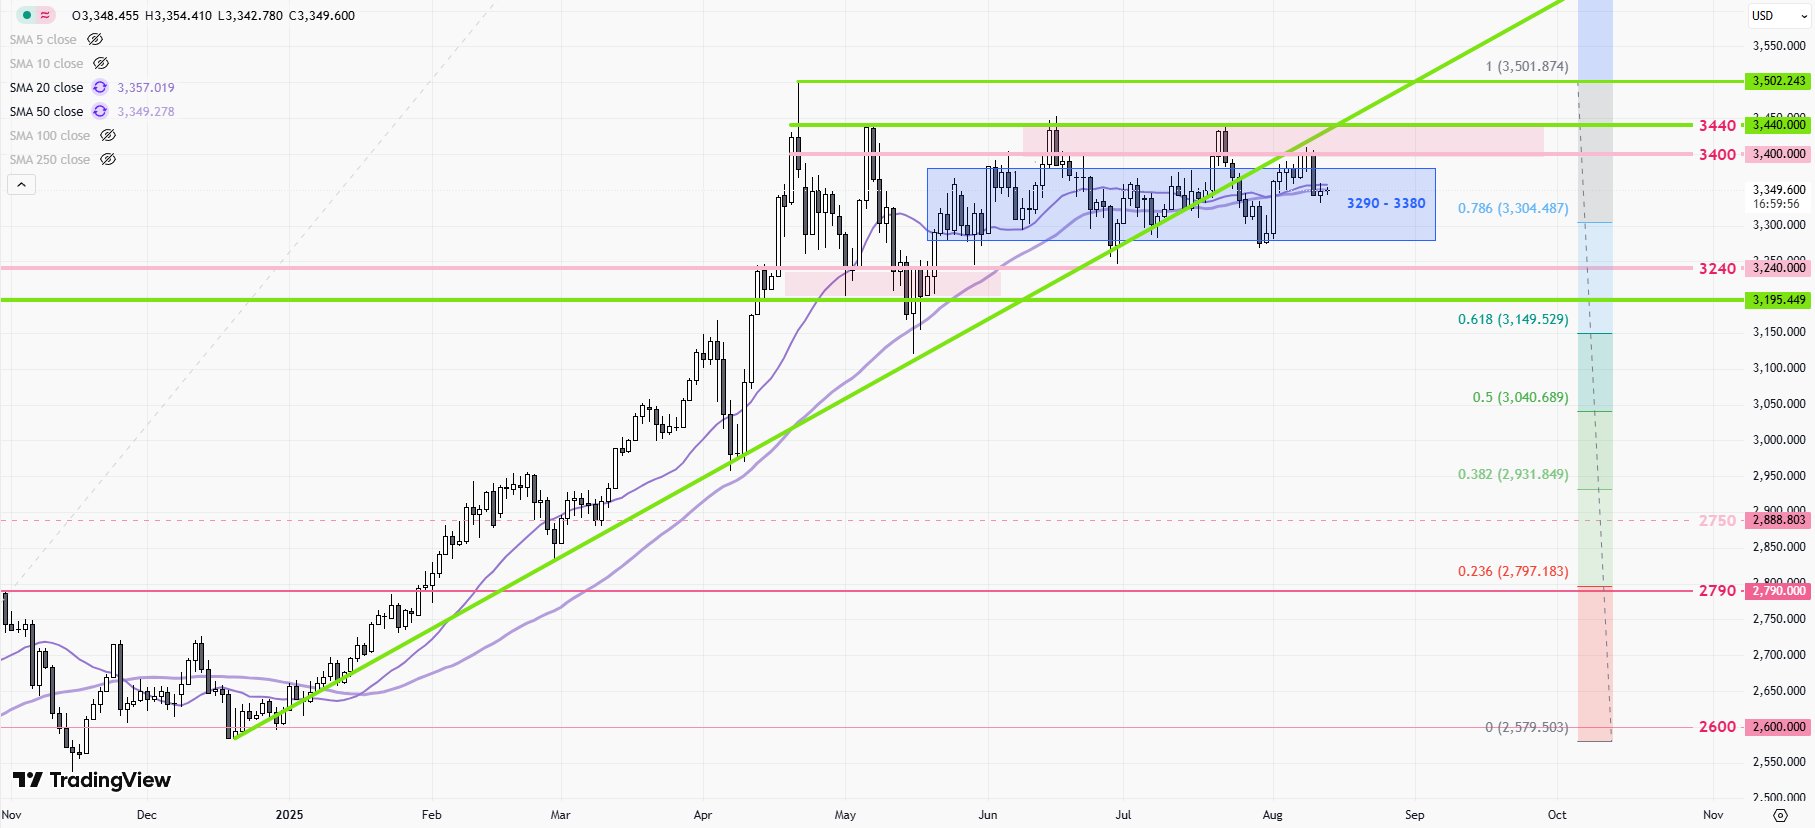
XAUUSD Daily Chart Analysis – August 13, 2025
Visible patterns and technical indicators:
The attached XAUUSD daily chart reveals pronounced candlestick volatility, with recent sessions dominated by long-bodied bearish candles, a series of lower highs, and persistent downward movement. The latest daily candles show consolidation near the $3,340–$3,350 area, with price having retreated sharply from resistance at $3,405. A key pivot zone is evident at $3,330—marked by repeated price tests and visible clustering of candlestick bodies and wicks—indicating strong support. Resistance zones are equally clear at $3,405, $3,430, and the critical $3,460 level.
Technical indicators implied, not shown:
– Moving Averages: Price structure indicates it is below typical mid-term (e.g., 50-day) and short-term (e.g., 21-day) moving averages, signifying bearish sentiment. The sloping action of prior candles implies declining averages.
– RSI (Relative Strength Index): Based on the magnitude and frequency of recent declines, RSI is likely near or just below 40, suggesting weak momentum but not yet extreme oversold conditions.
– MACD (Moving Average Convergence Divergence): The pattern of price breakdowns and failure to establish higher highs suggests the MACD line comfortably below the signal line, consistent with ongoing bearish momentum.
– Bollinger Bands: Recent candles are pressing or closing below the median band, with some likely breaching or shadowing the lower band—confirmation of trend strength and volatility expansion.
Prominent chart and candlestick patterns:
– Consolidation Zones: The chart displays several tight clusters of candles at $3,330–$3,350, forming a classic horizontal consolidation zone after a decline. This signals indecision and potential for breakouts in either direction.
– Bearish Engulfing Candle: The sharp reversal and strong bearish candle around $3,405 indicate a bearish engulfing pattern, which typically signals trend continuation downwards.
– No Major Reversal Formations: There is no visible “head & shoulders,” double top/bottom, or clear symmetrical triangle. The chart is characterized by trending swings and horizontal ranges, rather than complex reversal structures.
– Doji and Hammer Candles: Occasional dojis appear at key support, signaling indecision, but followed by continued selling—confirming bearish control.
Trend direction assessment:
Gold is currently in a downtrend following the rejection at resistance levels ($3,405–$3,430). The overall bias is bearish, with momentum favoring further declines unless strong reversal signals emerge. Price action remains orderly, forming lower highs and lower lows, which aligns with trend definitions.
Major support and resistance levels:
Support:
– $3,310
– $3,245
– $3,200
Resistance:
– $3,385
– $3,405
– $3,430
– $3,460
These levels are confirmed by visible price clusters, previous turning points, and repeated candle tests.
Additional technical insights:
– Volume (if visible): Volume trends are not apparent on the provided chart, but the character of the last selloff suggests participation increased on the way down, a typical indication of conviction selling and momentum continuation.
– Momentum shift: There is no convincing evidence of exhaustion or divergence; bearish momentum continues to dominate, with only brief pauses at support.
Actionable summary:
Gold (XAUUSD) remains under downside pressure, consolidating above key support at $3,330 and showing strong resistance at $3,405–$3,430. The trend is firmly bearish in the near term, with technical indicators pointing to further declines unless a decisive bounce materializes from support. Traders should monitor $3,330 closely: a breakdown signals extension toward $3,245 and $3,200; a sustained rally above $3,405 would challenge short-term bearish outlooks. Range trading may persist until a breakout from this consolidation zone occurs. Conservative positioning is warranted, with watches on critical support and resistance interactions.