 |
| Gold V.1.3.1 signal Telegram Channel (English) |
GBPUSD-Daily
2025-09-10 @ 15:42
Market Overview
GBPUSD traded mostly sideways over the past week, fluctuating within a roughly 200-pip range and showing mild bullish momentum capped by resistance at 1.3550 to 1.3600. Short-term buying pushed GBP higher, but traders remain cautious due to persistent resistance and uncertainty concerning potential Federal Reserve rate cuts. The recent movement was influenced by speculation around US monetary policy, a weaker-than-expected US non-farm payrolls report, and general risk sentiment in global markets. Despite mild rallies, GBPUSD has not decisively broken out and continues to face heavy technical barriers. The pair’s near-term direction will likely depend on upcoming Fed decisions and broader US dollar trends.
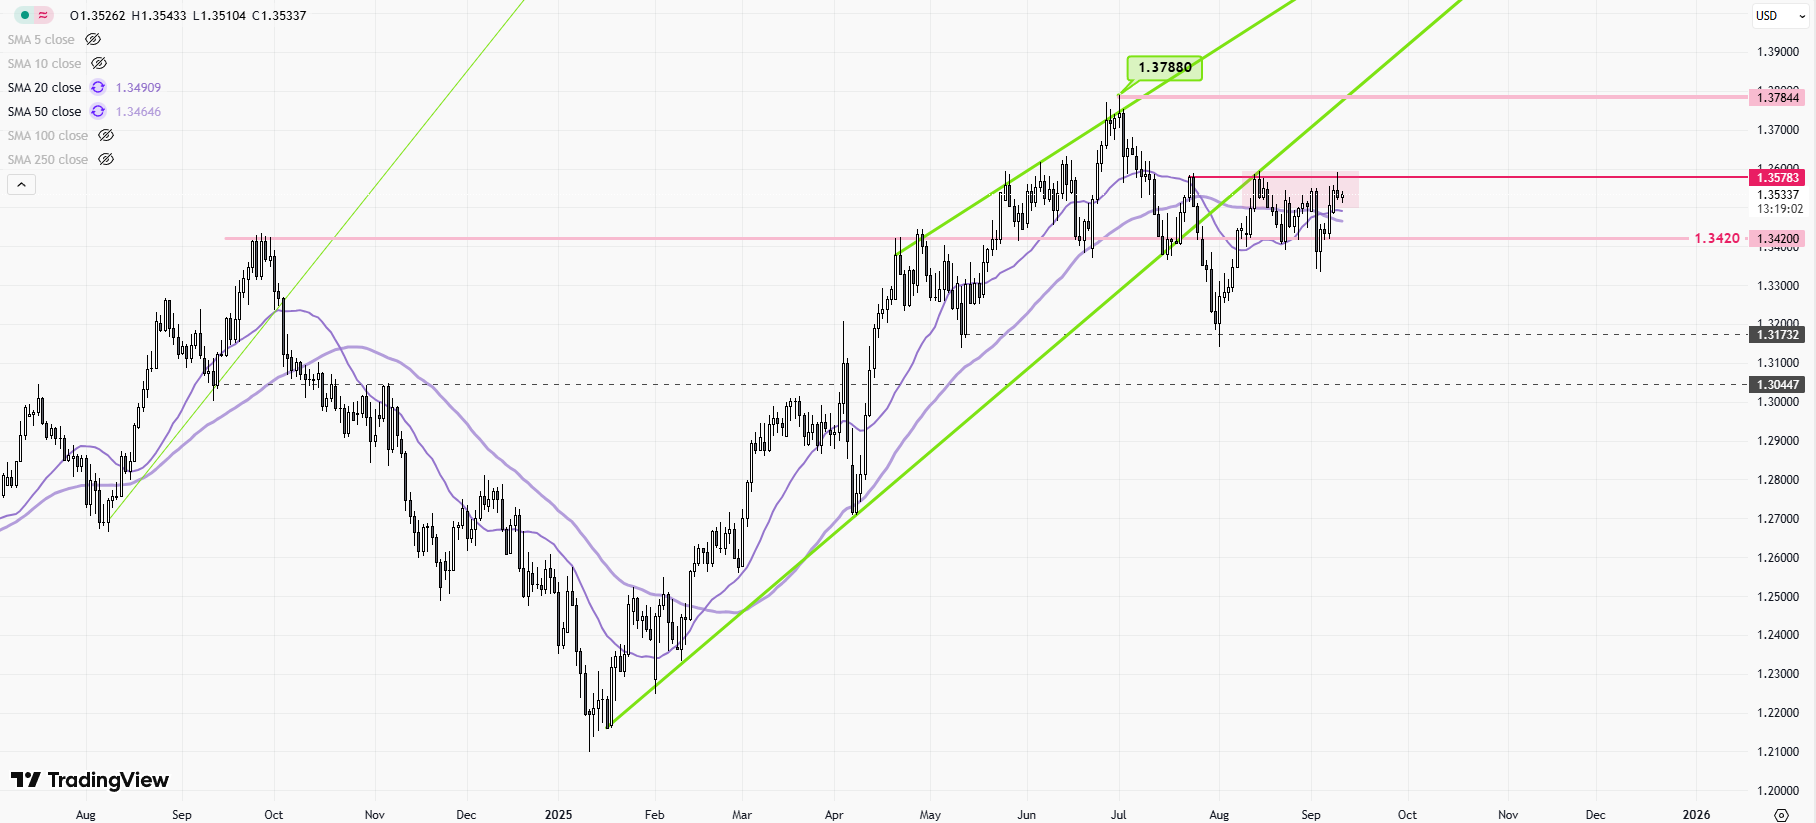
Analysis of GBPUSD Daily Candlestick Chart (September 2025)
The GBPUSD daily candlestick chart currently reflects a market transitioning out of a prior downtrend, with recent bullish momentum driving price above several key technical zones. The following is a thorough breakdown of the chart’s technical features, observable signals, and implied patterns.
Identified Chart Patterns and Technical Indicators
- Resistance Levels: The chart shows prominent resistance in the 1.3550–1.3600 zone. This area has capped rallies repeatedly and marks the upper edge of a 200-pip sideways range. A break above this level could ignite further buying and trigger short-covering.
- Support Levels: The 1.3428 zone formerly served as substantial resistance and now acts as support. The July low near 1.3143 remains a longer-term base.
- Recent Price Action: GBP/USD has rebounded strongly in recent weeks, rising from July’s low (1.3143) to 1.3552.
- Trend Direction: The market is currently in a sideways consolidation between 1.3350 and 1.3600, despite near-term bullish moves. While momentum has shifted upward, price remains confined by the aforementioned resistance zone.
- Candlestick Patterns: Multiple bullish candles have formed recently, confirming buying pressure; however, no clear single-session reversal patterns (such as hammer, doji, or engulfing) dominate the immediate price action. Watch for potential reversal signals as price approaches resistance.
- Ichimoku Cloud: The price has moved above the Ichimoku cloud—an indicator of emerging bullish sentiment and the potential for continued uptrend if resistance breaks.
- MACD: The chart shows price moving above the daily MACD line, supporting further upward movement with the Marlin oscillator also rising.
- RSI: Relative Strength Index has crossed above 50, signaling a shift to bullish momentum from previous neutral or bearish conditions.
Technical Indicators Not Displayed but Implied
- Moving Averages: Price is above the 50-day moving average, typically viewed as a bullish signal, with further confirmation possible if price remains above.
- MACD: The MACD crossover (price above signal line) reinforces the current bullish momentum.
- RSI: With RSI above 50, market momentum favors bulls, though not yet in overbought territory. Continued rise may prompt caution for short-term traders.
- Bollinger Bands: Not shown, but the strong rebound likely has price approaching or touching the upper band, hinting at elevated volatility and the chance for a pullback near resistance.
- Volume Trends: The chart does not display volume, but momentum shifts and sharp rallies typically correspond with surges in trading volume, indicating strong conviction behind the recent moves.
Major Support and Resistance Levels
- Resistance: 1.3550–1.3600 (recent highs and multi-session cap), with secondary resistance at 1.3631 and 1.3700 (upper price channel boundary, target levels).
- Support: 1.3428 (former resistance, swing high), 1.3350 (range floor), 1.3143 (recent multi-month low).
Prominent Chart Patterns
- There is no confirmed head and shoulders, double top/bottom, or triangle evident on the current chart.
- The broad sideways trading range between support and resistance levels is the dominant pattern.
- No evident reversal candlestick formations like doji or hammer in the last few sessions, but a close watch is warranted as price nears resistance.
Additional Technical Insights
- The market’s consolidation and repeated tests of resistance suggest indecision. Upcoming macro events, such as central bank rate decisions, could catalyze a breakout.
- A sustained break above the 1.3600 resistance zone would likely transition GBPUSD into a bullish phase, targeting 1.3631 and possibly 1.3700. Conversely, failure to break and a drop below 1.3428 would invalidate the bullish outlook and reintroduce downside risk.
Actionable Technical Outlook
- GBPUSD is currently range-bound but with clear bullish momentum. Only a confirmed breakout above the 1.3600 zone will signal further upside, targeting 1.3631 and 1.3700.
- Short-term traders may continue to play the established 200-pip range until one side prevails.
- Monitor for reversal candlestick patterns near resistance and watch for signals from implied technical indicators (MACD, RSI, moving averages) to gauge momentum shifts.
- Major upcoming economic announcements could trigger volatility and a decisive trend break—remain alert to headline risks.
In summary: GBPUSD daily is consolidating with bullish undertones. A break above 1.3600 will signal trend continuation; failure here will reinforce the range and risk a downward retrace. Use technical levels for tactical entries and exits as the market awaits its next catalyst.