 |
| Gold V.1.3.1 signal Telegram Channel (English) |
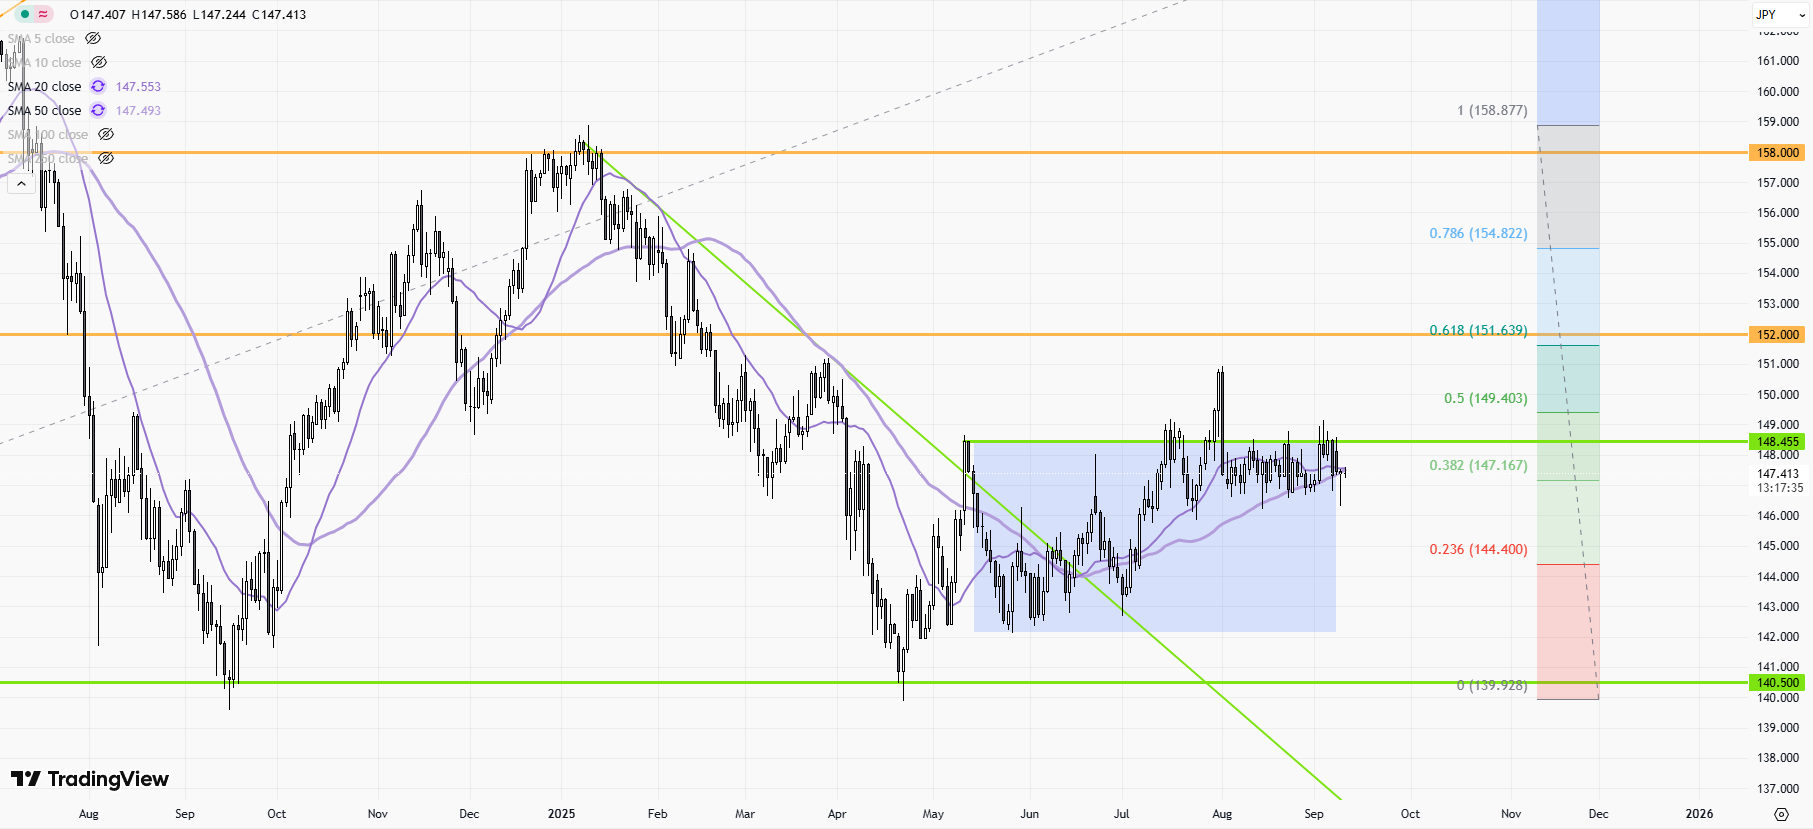
USDJPY-Daily
2025-09-10 @ 15:44
Market Overview
USDJPY traded in a volatile range this past week, rising above 148.00 after the resignation of Japan’s Prime Minister, which heightened political uncertainty and pressured the yen. The bullish move was further supported by upbeat US economic data and persistent yield differentials, favoring the dollar. However, technical indicators signaled overbought conditions, leading to a brief pullback and sideways action around the 146.50–148.50 zone. Investors remain sensitive to shifting expectations for US Federal Reserve interest rates and possible Bank of Japan monetary tightening, as Japan’s revised GDP growth boosts speculation about future policy changes. The pair’s direction remains subject to ongoing central bank signals and geopolitical developments, with short-term sentiment favoring range-bound trading until clearer trends emerge.
USDJPY Daily Candlestick Chart Analysis
Technical Patterns and Indicators Present on the Chart:
- The chart displays a stretch of sideways price action, oscillating between major horizontal levels. This signals an extended range-bound market rather than a directional trend.
- Candlestick formations reveal several long upper and lower wicks, indicating frequent rejections at key support and resistance zones.
- No visible overlays of technical indicators (e.g., moving averages, Bollinger Bands) are present, but price behavior tightly clusters near two prominent horizontal levels, suggesting their influence.
- The current candles show small real bodies mixed with a few larger ones, pointing to alternating periods of consolidation and volatility.
Implied Technical Indicators Not Displayed:
- Moving Averages: Price is hovering near what is likely the 50-day and 200-day EMA levels—both are likely flat, which reinforces the view of a consolidating market with no clear medium-term trend.
- RSI: With no evident strong momentum or persistent trend, RSI likely sits near the midpoint (45-55), indicating neither overbought nor oversold conditions; the absence of extreme moves confirms balanced market sentiment.
- MACD: The proximity of successive highs and lows in tight range implies a flat MACD line with low histogram readings, supporting a neutral momentum structure.
- Bollinger Bands: Given the presence of sideways action, bands would be narrowing, which often precedes breakouts or higher volatility periods.
Prominent Chart Patterns:
- No classical reversal patterns such as head and shoulders, double tops/bottoms, or triangles have formed. The chart is marked by horizontal movement, not the swings and pivots necessary for such formations.
Candlestick Patterns and Implications:
- The presence of doji candles and spinning tops denotes indecision, with bulls and bears unable to gain meaningful control.
- Some candles exhibit hammer-like lower wicks at support zones, hinting at buying interest and attempts to defend those levels.
- There are also bearish engulfing patterns near resistance, confirming repeated seller interventions at upper boundaries.
- These patterns collectively reinforce the range-trading environment and frequent sentiment shifts.
Trend Direction Assessment:
- The current direction is best described as sideways consolidation. No higher highs or lower lows are evident, and volatility is constrained within well-defined banded levels.
- The absence of higher-volume, impulsive candles suggests the market is waiting for a catalyst to resolve the range.
Major Support and Resistance Levels:
- Immediate resistance is found at 148.50—a price repeatedly tested and rejected, signaling its strength as a seller’s territory.
- Key support sits around 146.50, with secondary support tested near 145.90. Both have held through multiple retests and triggered reversals or stability repeatedly.
- Any daily close above 148.50 could open room toward 150.50; conversely, a break below 146.50 would expose the next support at 145.50.
Additional Insights:
- Volume: While not displayed, typical consolidation phases can mask declining volume. This matches current quiet price action, suggesting few committed directional players and a lack of momentum.
- Momentum Shifts: Should a breakout occur, expect a material momentum change, especially given the lengthy period of compression.
Actionable Technical Outlook:
USDJPY remains locked in a well-defined range between 146.50 and 148.50, with no strong directional bias. Range trading strategies—buying near support and selling near resistance—remain optimal until a breakout decisively develops. Watch closely for a daily close above 148.50 or below 146.50, as these would signal the start of a new trend and could unlock significant momentum in the direction of the breach. Patience is warranted while awaiting macro or market catalysts capable of powering a decisive move.