
 |
| Gold V.1.3.1 signal Telegram Channel (English) |

EURUSD: Triangle Consolidation on Daily Chart Signals Pending Breakout
2025-11-15 @ 21:45
EURUSD: Triangle Consolidation on Daily Chart Signals Pending Breakout
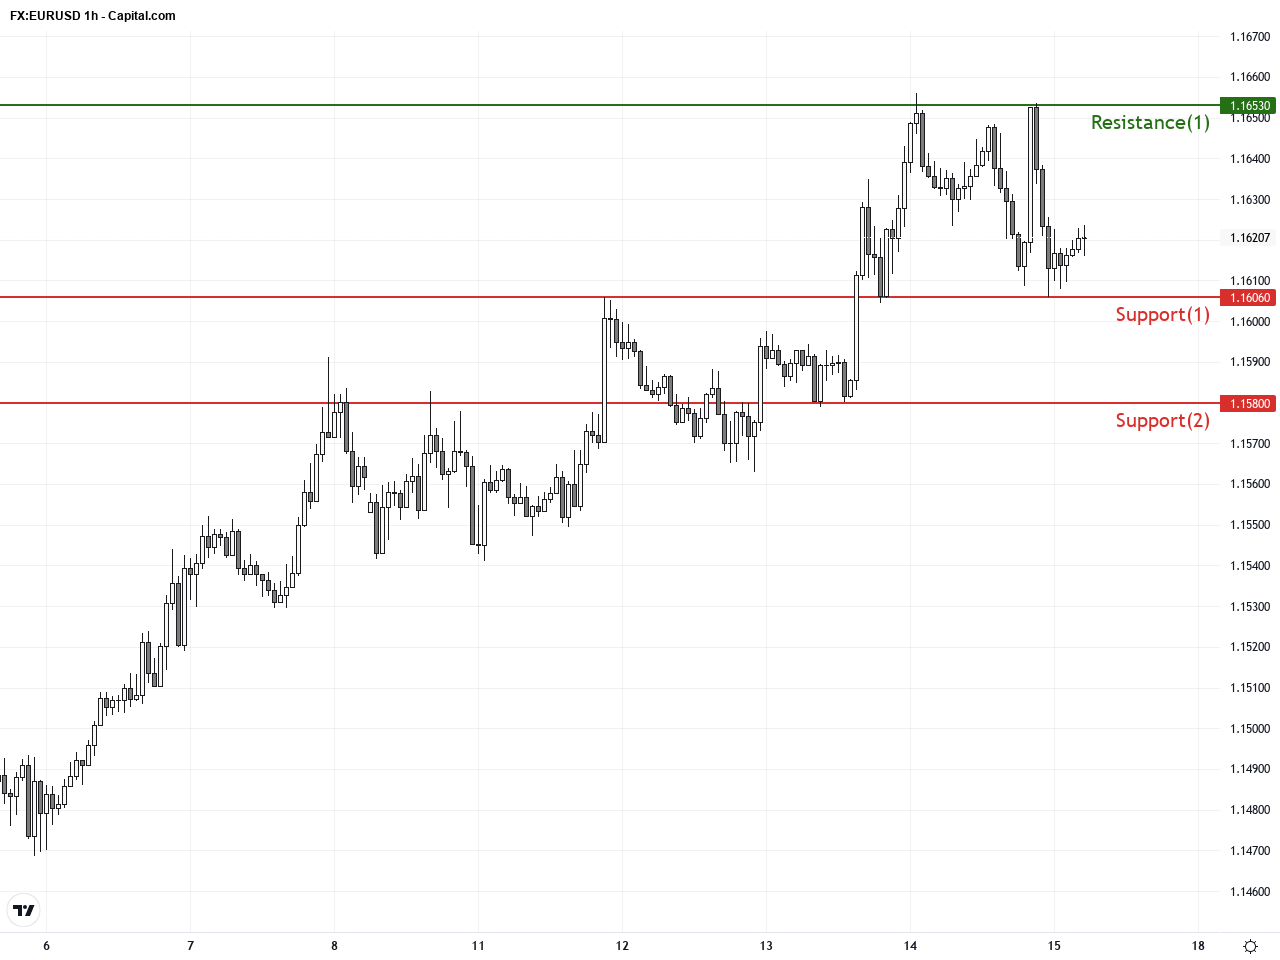
Over the past three trading days, EURUSD has been trading tightly between 1.1606 and 1.1653, closing yesterday at 1.16222. The absence of significant fundamental news has led to this narrow range, with investors focusing more on technical support and resistance levels for guidance. With no major economic data scheduled this week, market sentiment remains cautious, akin to pressing a pause button. Traders are advised to watch closely for definitive breakout signals that could set the direction for the short-term trend.
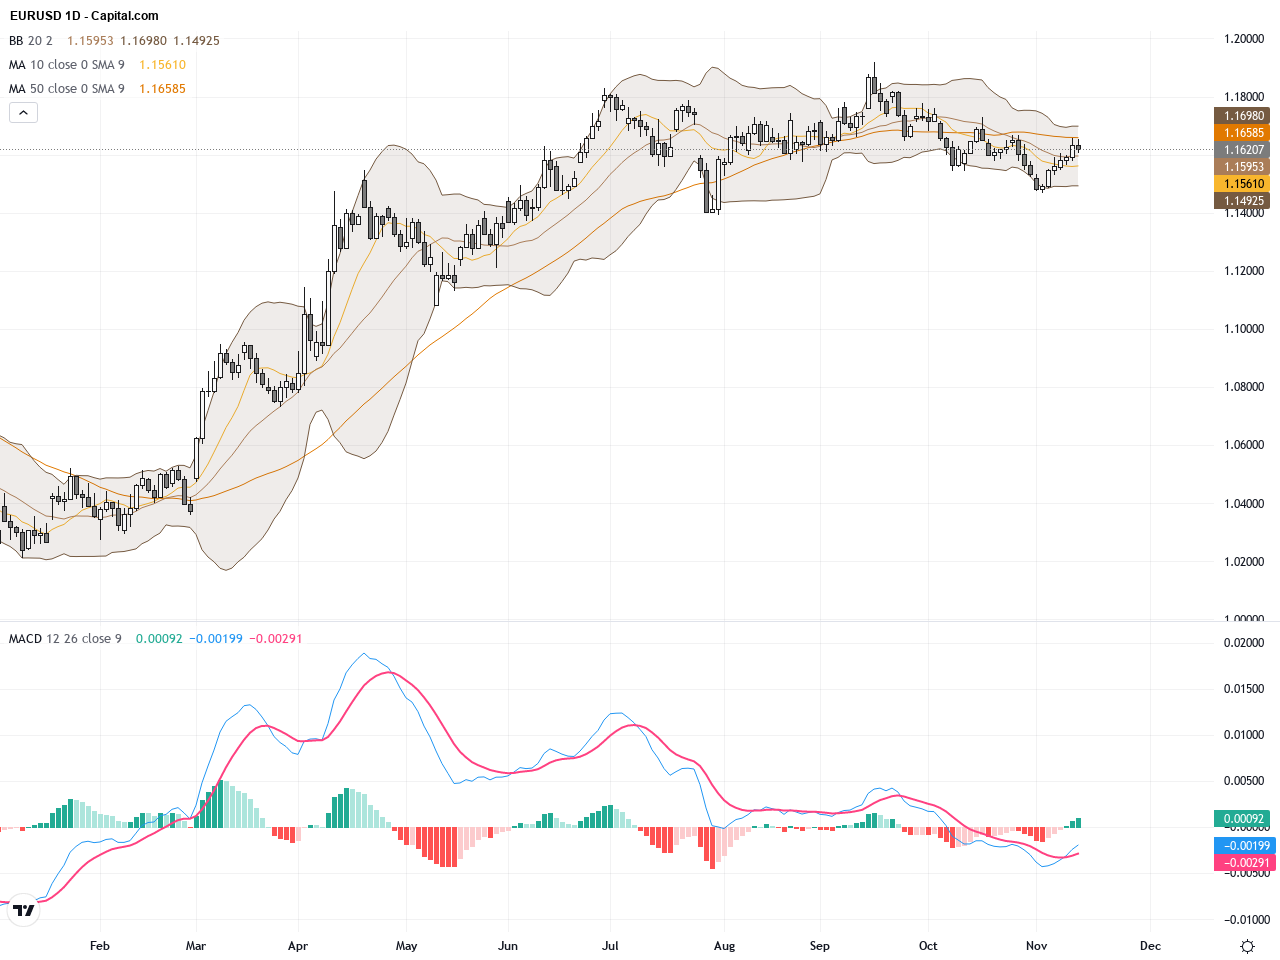
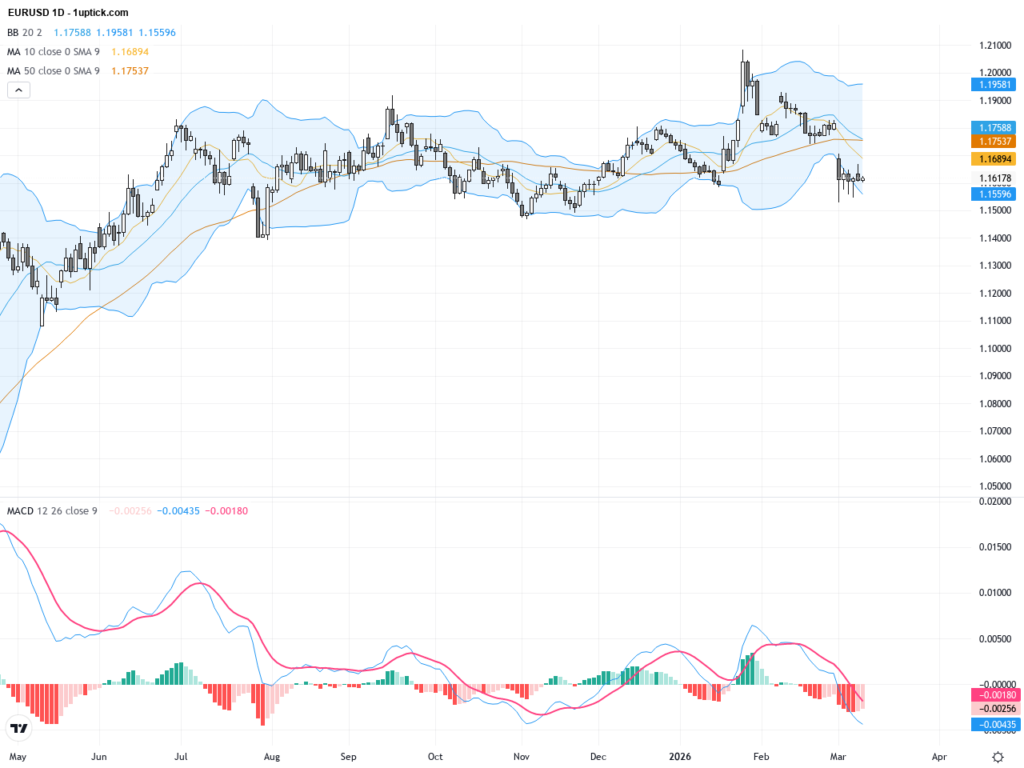
The daily chart shows EURUSD consolidating over the past 20 trading days within a range of roughly 1.16 to 1.17. Price action is approaching the upper edge of a triangle consolidation pattern, indicating an equilibrium between buyers and sellers. Bollinger Bands have contracted, signaling reduced volatility, and the MACD is hovering around the zero line without a clear directional bias. Short-term moving averages are flattening out, further confirming a lack of trend momentum. Overall, the daily chart suggests the market is awaiting a breakout.

On the hourly chart, EURUSD has oscillated between 1.1600 and 1.1650 over the past 3-5 days. A flag pattern has emerged, indicating potential for a directional move upon breakout. The MACD shows a modest bullish crossover while RSI remains in a mildly positive neutral zone, hinting at slight short-term buying pressure. A recent hammer candlestick at a key support area suggests buyers may be stepping in, potentially supporting a near-term rebound.
Technical Trend: The current trend is a cautiously bullish consolidation with the market awaiting a confirmed breakout, reflecting an overall tentative upward bias.
Technically, EURUSD is forming a triangle consolidation pattern with a recent hammer candlestick suggesting buyers could attempt to push prices higher. The MACD shows potential for a bullish crossover and RSI is stable, supporting a short-term uptrend bias. A breakout above 1.1653 could trigger further upward momentum, while a break below 1.1606 may lead to renewed downside pressure. Traders should carefully watch these key levels for potential trade setups.There are no significant economic events scheduled today that are expected to directly impact EURUSD. Market participants are primarily relying on technical analysis and existing fundamental conditions. Without major catalysts, price action may remain range-bound as traders await future data releases or news events for clearer directional cues.
Resistance & Support
<
p style=”padding: 10px; margin: 20px 0; border: solid 1px #fa003f; border-radius: 5px;”>The above financial market data, quotes, charts, statistics, exchange rates, news, research, analysis, buy or sell ratings, financial education, and other information are for reference only. Before making any trades based on this information, you should consult independent professional advice to verify pricing data or obtain more detailed market information. 1uptick.com should not be regarded as soliciting any subscriber or visitor to execute any trade. You are solely responsible for all of your own trading decisions.