


 |
| Gold V.1.3.1 signal Telegram Channel (English) |

GBPUSD: Major Resistance Test Looms as Tight Range Signals a Breakout Setup
2025-11-10 @ 16:06
GBPUSD: Major Resistance Test Looms as Tight Range Signals a Breakout Setup
GBPUSD has spent the past three trading days largely consolidating between 1.313 and 1.316, closing yesterday at 1.31468. Price action has been muted, but trading volume is on the rise, indicating cautious sentiment and a buildup in positioning. With no major market news impacting the pair, technical factors dominate—especially as bulls and bears battle near the weekly high at 1.31664 and support at 1.31335. For everyday investors, the takeaway is clear: GBPUSD’s calm may quickly give way to a sharp move once breakout momentum builds, so vigilance is key as the market positions for a technical catalyst.
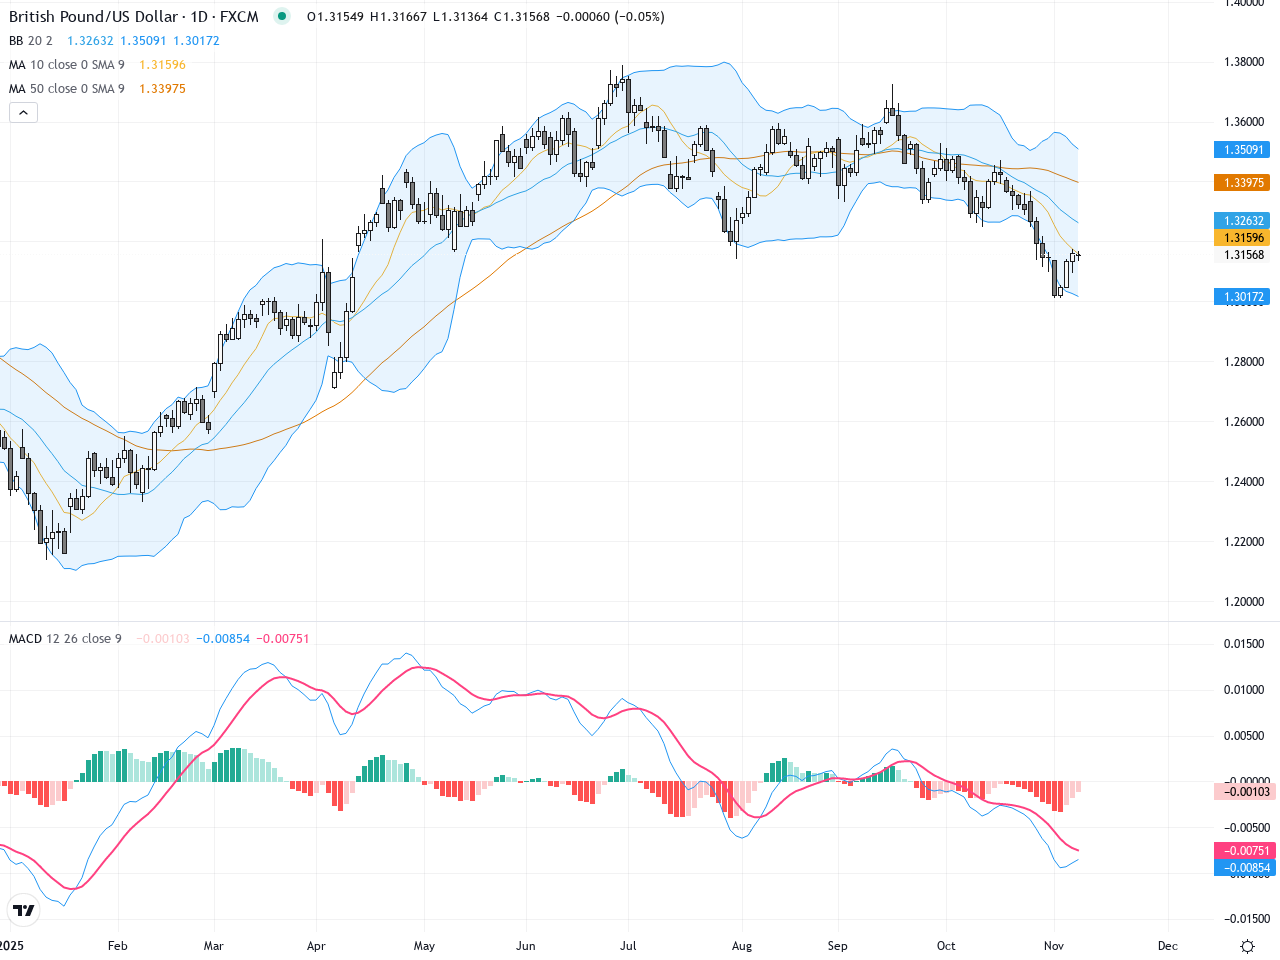
On the daily chart, GBPUSD has steadily rebounded from end-of-October setbacks, with the 5-day and 10-day moving averages sloping upward and price action remaining mostly above these averages, reflecting a strong base-building phase. Bollinger Bands have narrowed significantly, suggesting that a volatility spike could be imminent. MACD momentum bars are trending higher, hinting at a potential bullish crossover. The dominant visual structure is a ‘symmetrical triangle,’ with price highs and lows tightening over the past 20 sessions—a classic precursor to a breakout.
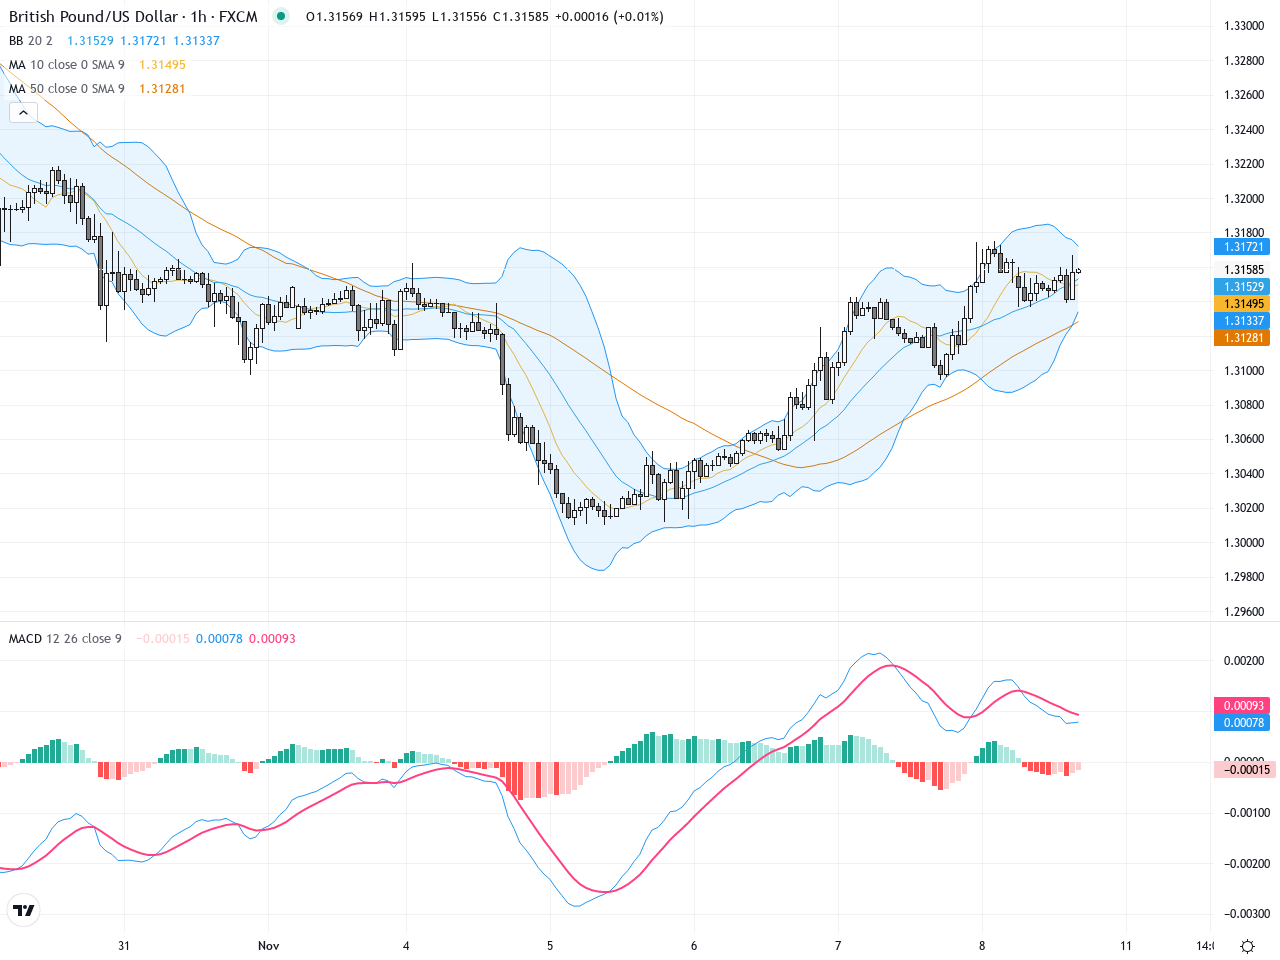
Hourly chart review over the past 3-5 days shows tight range trading between 1.3135 and 1.3165, with about 40 candles reflecting multiple failed breakout attempts (wicks piercing support and resistance but no clear sustain). The 20-period and 60-period moving averages are intertwined, confirming a neutral, flat momentum base. MACD shows a recent minor bearish cross, indicating indecision, while a prominent lower-shadow candle signals near-term buying defense. Clearer direction hinges on a convincing close above resistance or below support.
Technical Trend: Volatile sideways, with both bulls and bears awaiting a breakout trigger.
Technical analysis points to GBPUSD being in a volatility squeeze—the ‘symmetrical triangle’ pattern underlines an imminent directional move. The latest standout candlestick is a daily Doji, signaling hesitation and suggesting the next 24 hours could spark decisive price action, especially if 1.3166 is breached with increased volume. The converging MACD and narrowing Bollinger Bands reinforce the likelihood of a breakout trade opportunity.
Resistance & Support
https://1uptick.com/wp-content/uploads/2025/11/hourly-chart-ENrs2025-11-10T090603.6920100.png
<
p style=”padding: 10px; margin: 20px 0; border: solid 1px #fa003f; border-radius: 5px;”>The above financial market data, quotes, charts, statistics, exchange rates, news, research, analysis, buy or sell ratings, financial education, and other information are for reference only. Before making any trades based on this information, you should consult independent professional advice to verify pricing data or obtain more detailed market information. 1uptick.com should not be regarded as soliciting any subscriber or visitor to execute any trade. You are solely responsible for all of your own trading decisions.