


 |
| Gold V.1.3.1 signal Telegram Channel (English) |

AUDUSD: Breakout Signals Continued Bullish Momentum Amid Key RBA Week
2025-12-08 @ 08:01
Over the past 24 to 48 hours, the Australian Dollar (AUD/USD) has performed strongly, climbing from the previous day’s close of around 0.66348 to briefly hitting a high of 0.66423. This rally highlights the market’s keen focus on the upcoming Reserve Bank of Australia (RBA) interest rate decision and the Federal Open Market Committee (FOMC) policy outlook. Central bank rate policies have been the key driver behind the currency’s volatility, especially as market expectations build around further rate hikes from the RBA.
Recent market news points to a surge in consumer spending as a surprising catalyst boosting expectations of RBA rate hikes, further drawing investor optimism around the AUD. Additionally, the market broadly views Australia’s economy as resilient, supporting the currency’s strength while the US Dollar remains relatively weak, thereby intensifying upward pressure on the AUD/USD pair.
For the average investor, this means holding Australian Dollar assets could offer favorable returns at this stage, particularly amid increasing divergence in global central bank policies. For risk-tolerant traders, the Aussie’s performance not only reflects improved economic fundamentals but also signals a clearer market expectation about future monetary policy direction. Overall, this accelerating rally has positioned the AUD as a standout performer in the forex market spotlight.
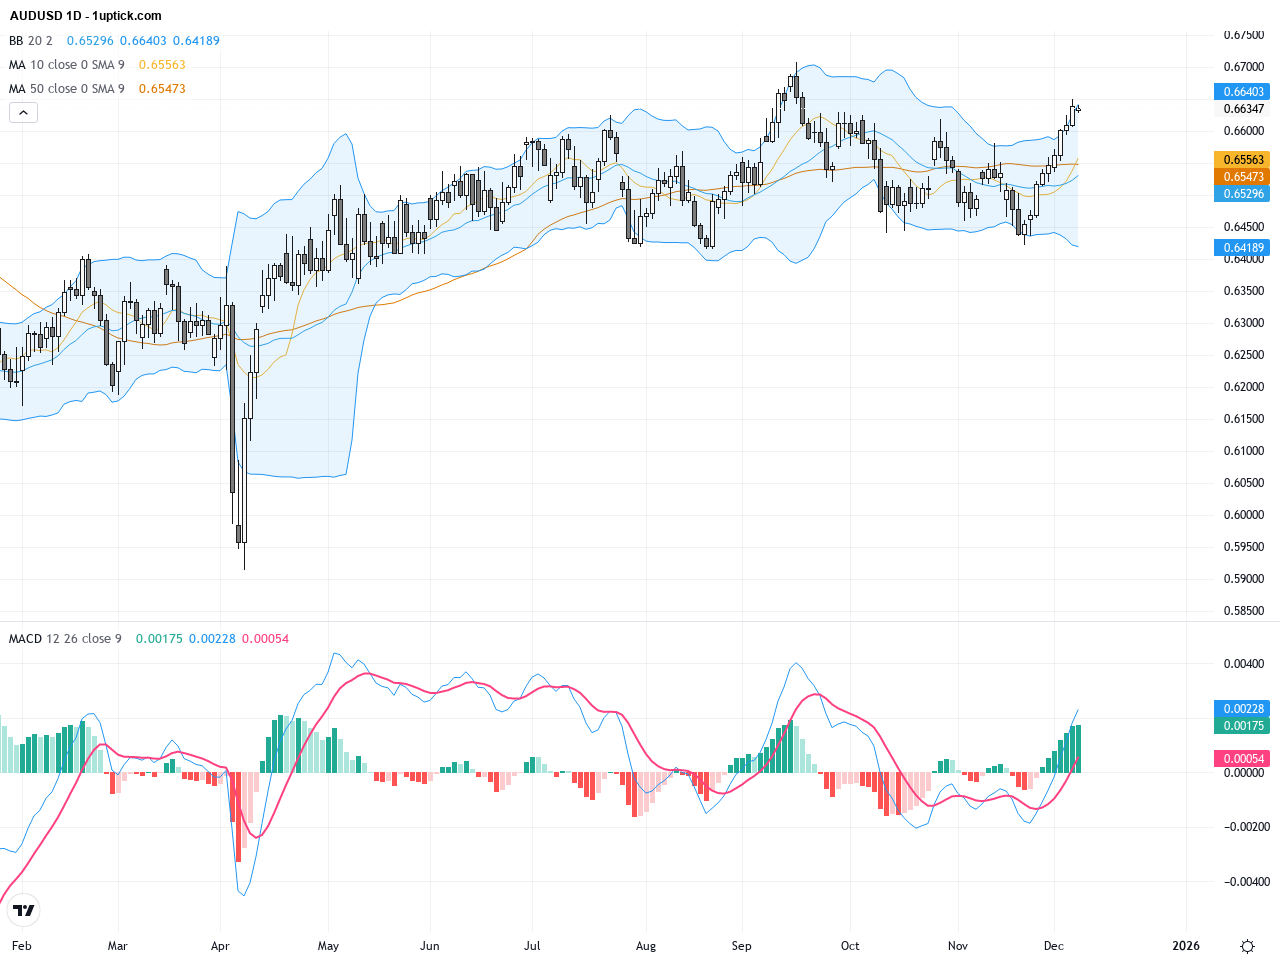
The daily chart depicts a clear uptrend in AUDUSD, with the price steadily climbing from recent lows. Both the 50-day and 200-day moving averages slope upwards, confirming bullish momentum over the medium to long term. The Bollinger Bands are expanding, indicating rising volatility and price action near the upper band, which signals strong buyer control. The MACD remains in a golden cross configuration, reinforcing sustained momentum to the upside. Overall technical setup supports the bullish market sentiment and suggests the rally has further room to run.
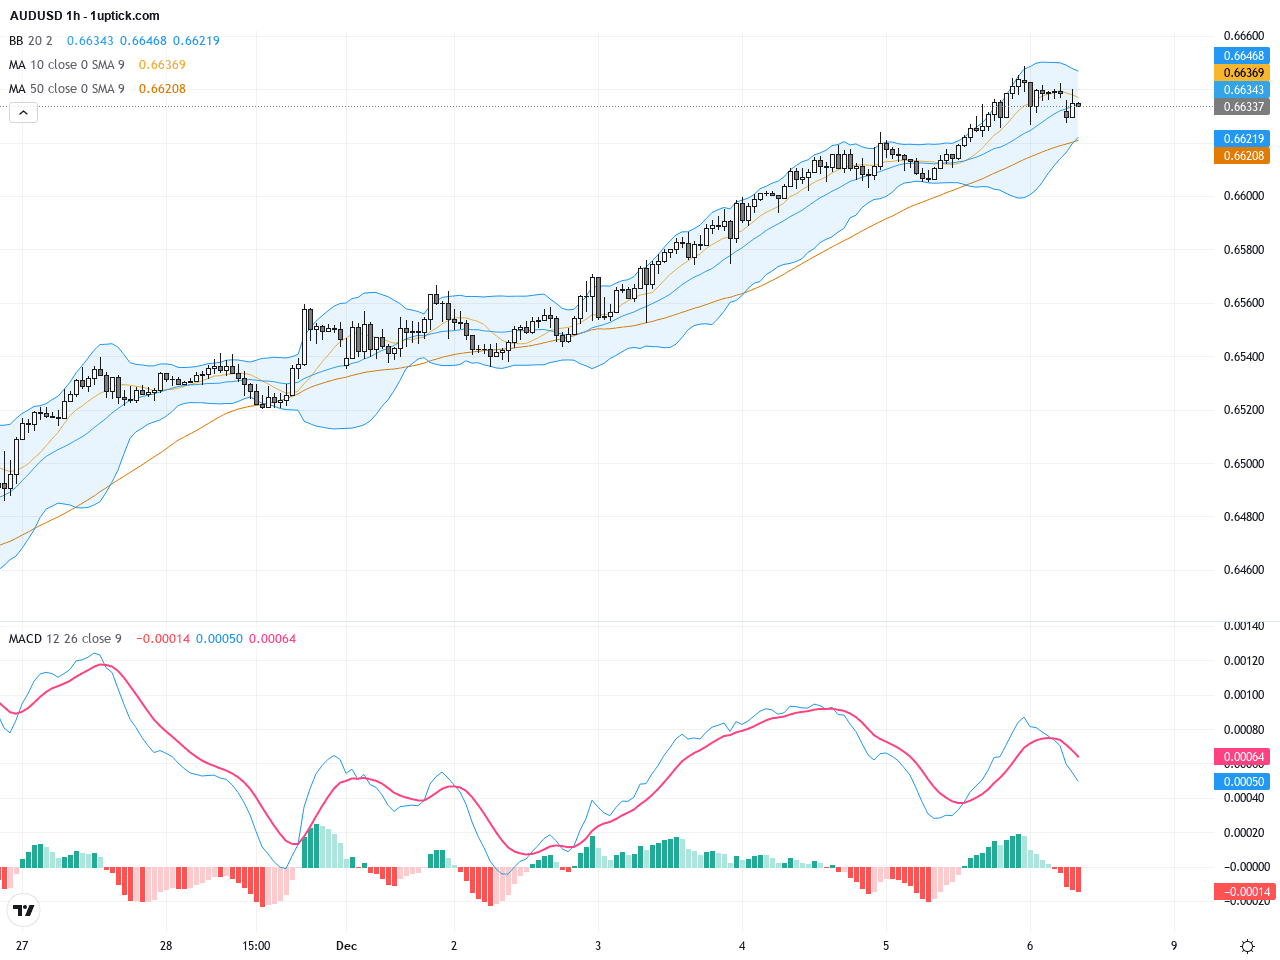
The hourly chart over the last 3 to 5 days shows AUDUSD consolidating briefly before breaking above key resistance near 0.6620, forming a bullish triangle breakout pattern. Price action remains supported above moving averages while Bollinger Bands widen upward. The MACD histogram indicates strengthening momentum, and the RSI is near 70 without being overbought, hinting at further near-term upside potential. This clear short-term trend aligns well with a trend-following strategy for traders.
Technical Trend: Clearly bullish with strong momentum
Technical analysis indicates a strong bullish market for AUDUSD, with price breaking out of previous channels and resistance levels, limiting downside risk. The combination of a MACD golden cross and expanding Bollinger Bands suggests momentum is strengthening. The recent triangle breakout on the hourly chart and well-defined support levels provide high-probability long entry signals. Traders should watch for buying opportunities on minor pullbacks and remain attentive to RBA and FOMC news to manage positions effectively.There are no significant or directly relevant economic events scheduled today that would impact AUDUSD. While Japan will release Q3 GDP and current account data, and Germany and the Czech Republic will report industrial production and unemployment rates respectively, these have limited immediate influence on the AUDUSD pair. Thus, the AUDUSD is expected to remain mainly driven by international risk sentiment and RBA policy expectations today.
Resistance & Support

<
p style=”padding: 10px; margin: 20px 0; border: solid 1px #fa003f; border-radius: 5px;”>The above financial market data, quotes, charts, statistics, exchange rates, news, research, analysis, buy or sell ratings, financial education, and other information are for reference only. Before making any trades based on this information, you should consult independent professional advice to verify pricing data or obtain more detailed market information. 1uptick.com should not be regarded as soliciting any subscriber or visitor to execute any trade. You are solely responsible for all of your own trading decisions.