


 |
| Gold V.1.3.1 signal Telegram Channel (English) |

AUDUSD: Bullish Breakout Driven by RBA Hawkish Signals and Technical Momentum
2025-12-24 @ 08:01
Over the past 24 to 48 hours, the AUD/USD pair experienced notable volatility, climbing from yesterday’s close around 0.66596 to nearly 0.6680 at its intraday peak, showing strong upward momentum. The release of the Reserve Bank of Australia (RBA) meeting minutes indicated a hawkish stance with potential further interest rate hikes, providing robust support for the Australian Dollar. This signal heightened market expectations of tightening monetary policy in Australia, resulting in the AUD outperforming other major currencies.
Meanwhile, the US Dollar showed relative weakness during the same period, further boosting AUD/USD gains. Although risk sentiment fluctuations and disappointing economic data from China capped some of the Australian Dollar’s upside, the overall outlook is positive, driven by strong Australian economic fundamentals and the prospect of RBA tightening. For the average investor, this can be seen as the RBA’s hawkish pivot reinforcing the AUD’s role as a high-yield currency haven, increasing confidence in the currency and pushing its price higher.

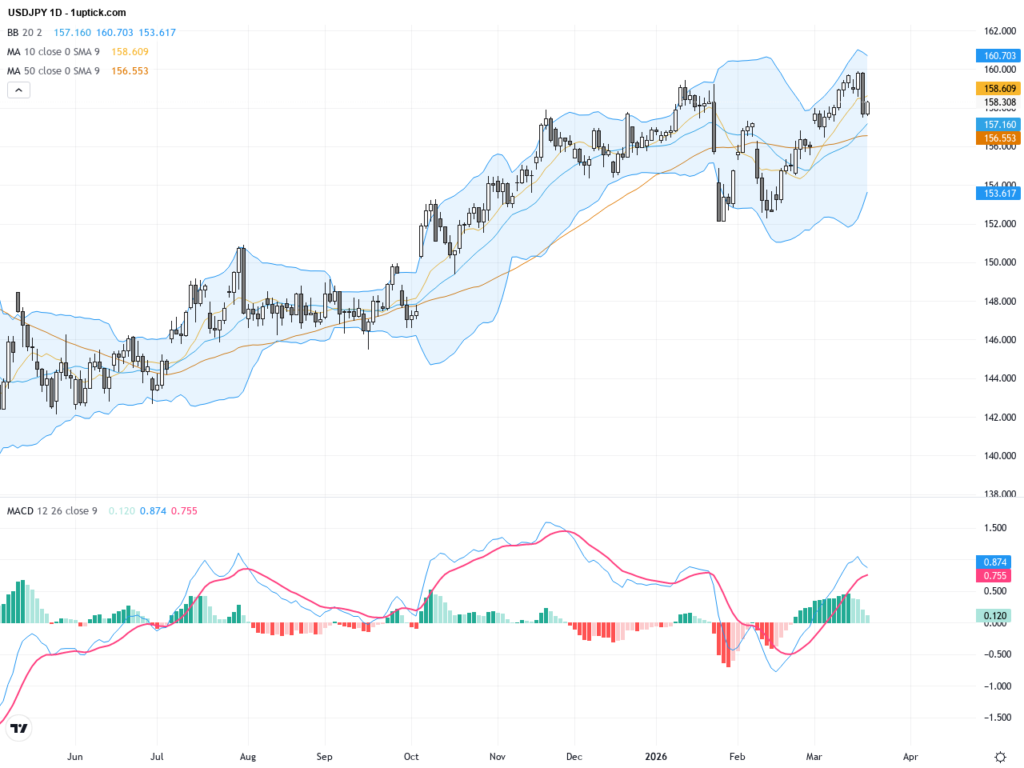
The daily chart reveals a strong uptrend over recent weeks, with AUDUSD breaking above the 50-day and 200-day moving averages, establishing a solid bullish base. Bollinger Bands are widening, with price frequently touching the upper band, while the MACD remains above zero and expanding, indicating strong bullish momentum. The RSI has rebounded to around 70, signaling robust buying pressure without clear overbought conditions. Overall, the technical picture reflects positive market sentiment encouraged by the RBA’s hawkish stance.
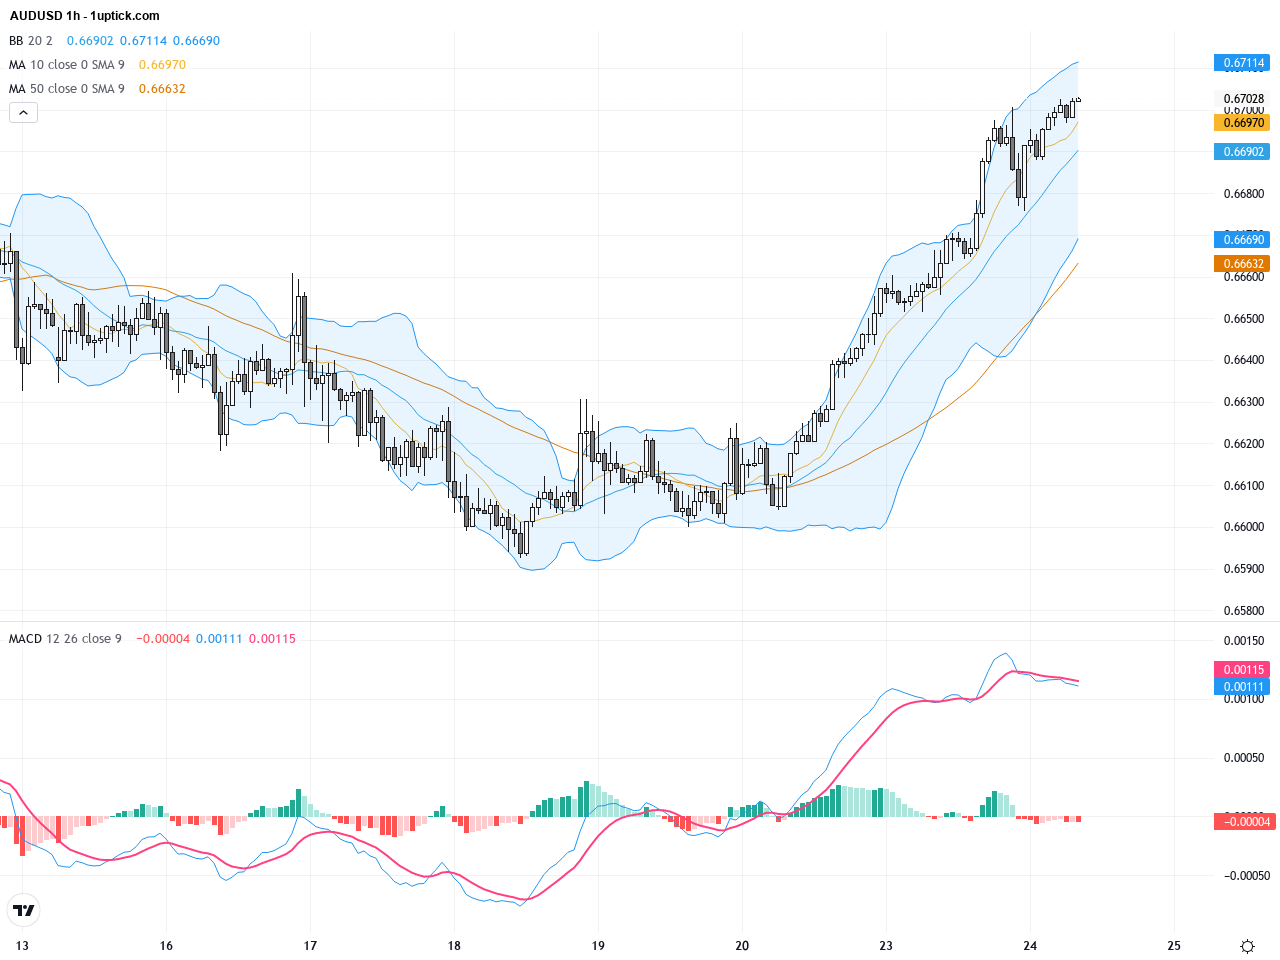
In the past 3-5 days on the hourly chart, AUDUSD shows a consolidating upward trend. Short-term moving averages align bullishly while the price consolidates and holds above the 0.66 level, with Bollinger Bands tightening and then expanding again, signaling increased volatility. A recent MACD golden cross indicates a strengthening short-term upward momentum. Volume is slightly increasing, confirming active buying. Chart patterns like a small flag or possible cup-and-handle suggest potential for another upside breakout within the next 24 hours.
Technical Trend: AUDUSD is currently showing a decisively bullish trend, with strong momentum in both short-term and medium-term timeframes, signaling a clear upward direction.
Technically, AUDUSD confirms a strong breakout on daily and intraday timeframes. The MACD bullish crossover and RSI recovery from oversold regions reinforce buyer confidence. The widening Bollinger Bands and approach to the 2025 high of 0.67047 suggest potential attempts to test higher resistance. The intraday golden cross paired with bullish chart patterns provides high probability for continued upward moves. Monitoring the 0.67 support is critical alongside a potential breakout above 0.6740 for trade entries.The key economic event today relevant to AUDUSD is the RBA Minutes release at 01:30 GMT+1, providing vital insight into future monetary policy. The hawkish tone is expected to continue supporting AUD strength. US data releases around 14:30 GMT+1 — including GDP and PCE Core inflation — could cause temporary USD strength if better than expected, imparting short-term pressure on AUDUSD. Other global releases are less directly impactful on the pair today.
Resistance & Support

The above financial market data, quotes, charts, statistics, exchange rates, news, research, analysis, buy or sell ratings, financial education, and other information are for reference only. Before making any trades based on this information, you should consult independent professional advice to verify pricing data or obtain more detailed market information. 1uptick.com should not be regarded as soliciting any subscriber or visitor to execute any trade. You are solely responsible for all of your own trading decisions.