


 |
| Gold V.1.3.1 signal Telegram Channel (English) |
AUDUSD: Key Technical Breakout Drives Australian Dollar Strength, Clear Trading Outlook
2025-12-10 @ 08:02
Over the past 24 to 48 hours, the Australian Dollar against the US Dollar (AUD/USD) has shown a steady upward trend, with a slight price increase on Tuesday and limited volatility. The previous closing price was 0.66406, with the day’s intraday low at 0.66334 and high around 0.66454, reflecting a positive market reaction to the Reserve Bank of Australia’s (RBA) decision to hold interest rates steady.
The RBA kept the interest rate at 3.6% while signaling inflation risks, which garnered significant attention among investors. The bank’s hawkish tone suggests that monetary policy easing may not be forthcoming soon, lending support to the Aussie dollar. The market response was rational, with a steady bullish pattern rather than sharp swings, especially amid uncertainty around the Federal Reserve’s policy outlook, giving the AUD a safe-haven boost.
For the average investor, this situation is like a race where the organizer announces no changes to the track conditions but warns of possible worsening weather. The racers then maintain a steady pace, mindful of the caution but keeping their speed up. For AUD/USD traders, this means increased confidence in holding the Australian Dollar due to unchanged central bank policy but with watchful eyes on future policy adjustment signals.
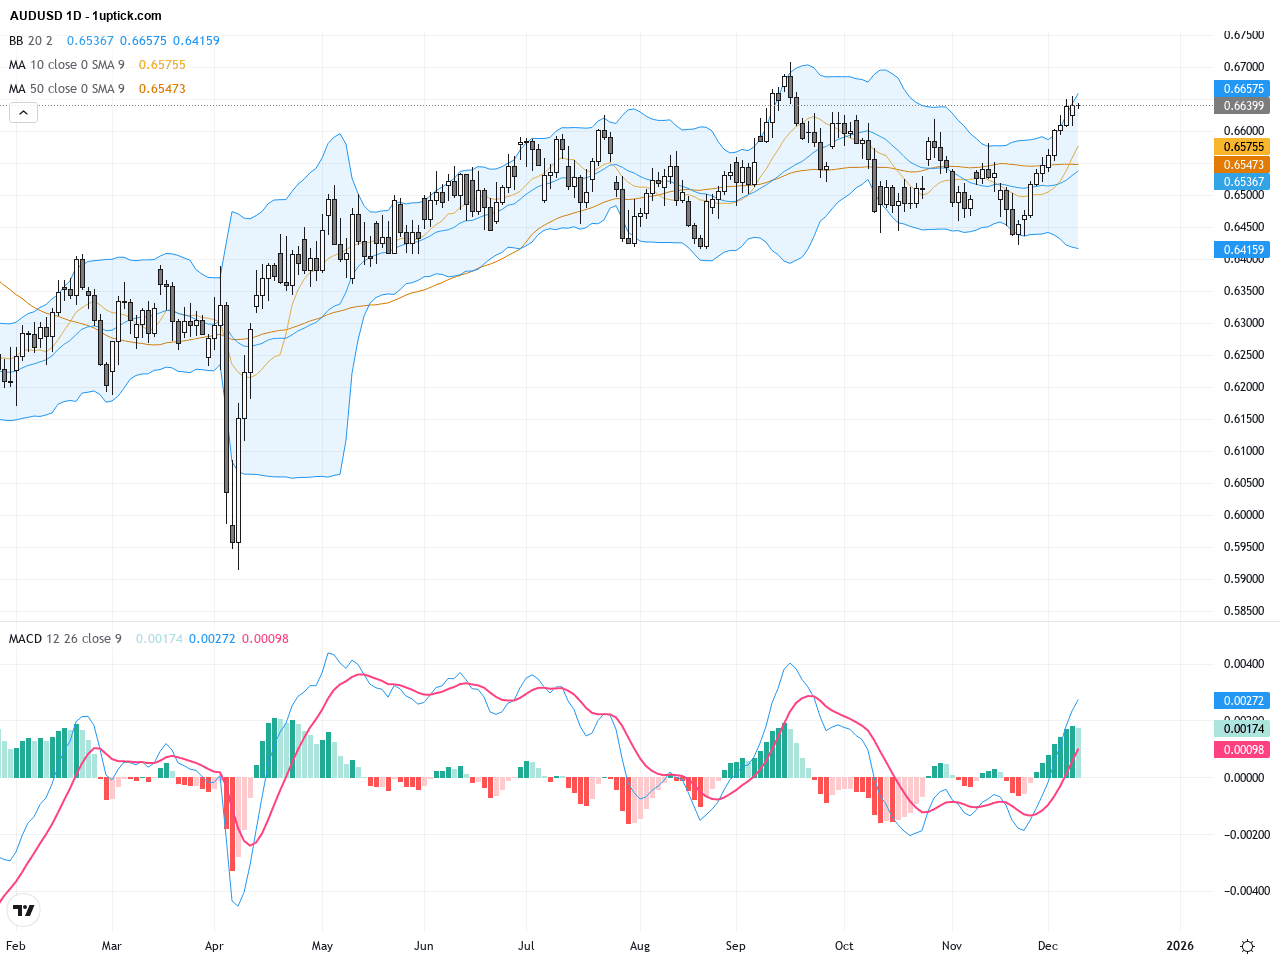
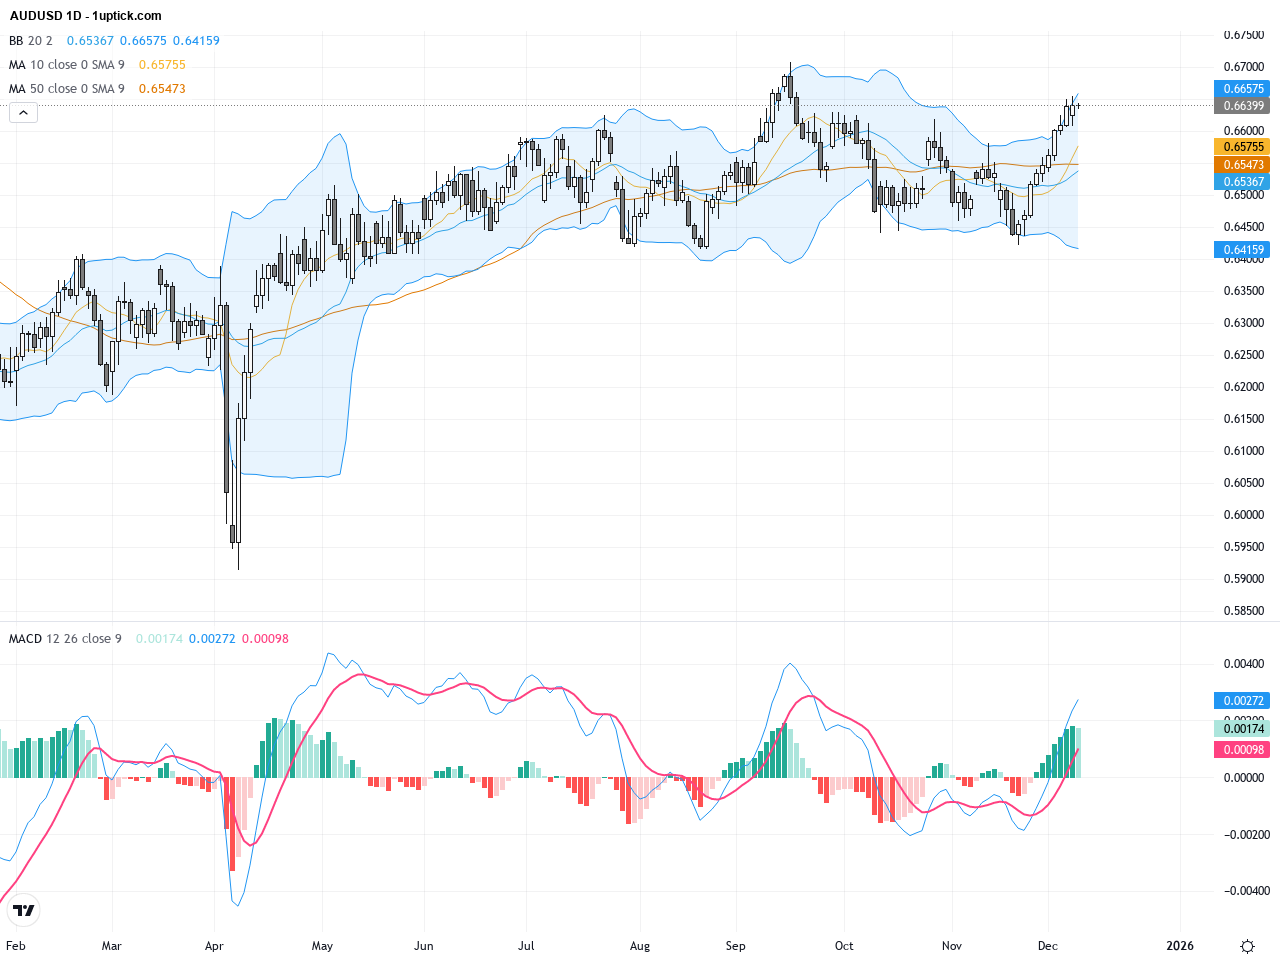
The daily chart shows a mild uptrend for AUDUSD, climbing steadily from around 0.6500 to the current level near 0.66395. The price remains comfortably above the 50-day and 200-day moving averages (around 0.6525 and 0.6515 respectively), indicating a solid bullish trend. Bollinger Bands are tightening, signaling reduced volatility but sustained positive momentum. The MACD remains positive and shows bullish momentum, supporting potential further gains. Overall, the technical setup points to a healthy medium-to-long-term bullish bias awaiting the next breakout move.

The hourly chart over the past 5 days highlights consolidation between 0.6605 and 0.6645 with a breakout of a major trendline on December 9, coinciding with a bullish MACD crossover indicating strong short-term momentum. The Bollinger Bands’ middle line acts as support with price maintaining an upward trajectory. The recent low near 0.6600 offers a solid support base. Sustained holding above this level could trigger further upside moves as the market digests fundamental developments, offering a tactical entry point for traders looking for trend continuation.
Technical Trend: Current Trend: Steady Bullish
Technically, AUDUSD has broken above a key long-term trendline on the daily chart and remains supported by its moving averages. The MACD shows a bullish golden cross. On the hourly chart, the breakout from the consolidation zone paired with a bullish MACD crossover suggests strong momentum. Recent candlestick patterns, including a bullish inverted hammer, indicate buyers are gaining control and point to potential upside over the next 24 hours. In summary, momentum favors bulls and traders could look for pullbacks to support levels for high-probability buy entries.Today’s key economic data include China’s Consumer Price Index and Industrial Production releases at 02:30 GMT+1, along with various European industrial data throughout the morning. However, these have limited direct impact on AUDUSD. The most relevant event is the U.S. Federal Reserve’s FOMC interest rate decision and accompanying economic projections scheduled for 20:00 GMT+1. This has significant influence on USD strength and thus AUDUSD’s price. A hawkish Fed would likely strengthen USD and pressure AUDUSD lower; a dovish tone would favor AUDUSD gains. Traders should monitor this closely for potential volatility.
Resistance & Support

The above financial market data, quotes, charts, statistics, exchange rates, news, research, analysis, buy or sell ratings, financial education, and other information are for reference only. Before making any trades based on this information, you should consult independent professional advice to verify pricing data or obtain more detailed market information. 1uptick.com should not be regarded as soliciting any subscriber or visitor to execute any trade. You are solely responsible for all of your own trading decisions.