


 |
| Gold V.1.3.1 signal Telegram Channel (English) |

AUDUSD: Key Trendline Break Signals Potential Strong Rebound with Technical Patterns in Play
2025-12-15 @ 08:01
Over the past 24 to 48 hours, the AUD/USD pair initially surged but then faced some pullback. The closing price yesterday was 0.66472, down from the previous day’s 0.66653. Traders have been closely assessing the Federal Reserve’s outlook following its recent rate cut, which has been the key driver behind market volatility.
Recent Australian employment data missed expectations, causing AUD/USD to dip during Asian trading hours. Nonetheless, the Reserve Bank of Australia’s (RBA) somewhat hawkish stance has provided support to the Aussie, keeping the pair hovering above the mid-0.6600 level and preventing a sharp decline. Meanwhile, the Fed’s policy outlook has kept investors cautious, impacting sentiment in the Asia-Pacific currency markets, especially with stronger demand for the US dollar.
For the average investor, these movements reflect a tug of war between two major forces: Australia’s domestic economic performance, such as jobs data, and the global monetary policy direction led by the biggest economy—the US. In other words, if Australian economic data continue to disappoint, it could weigh on the AUD, while a firm dollar driven by clear Fed signals would add downward pressure on AUD/USD. Investors need to monitor both closely to gauge where the pair might head next.
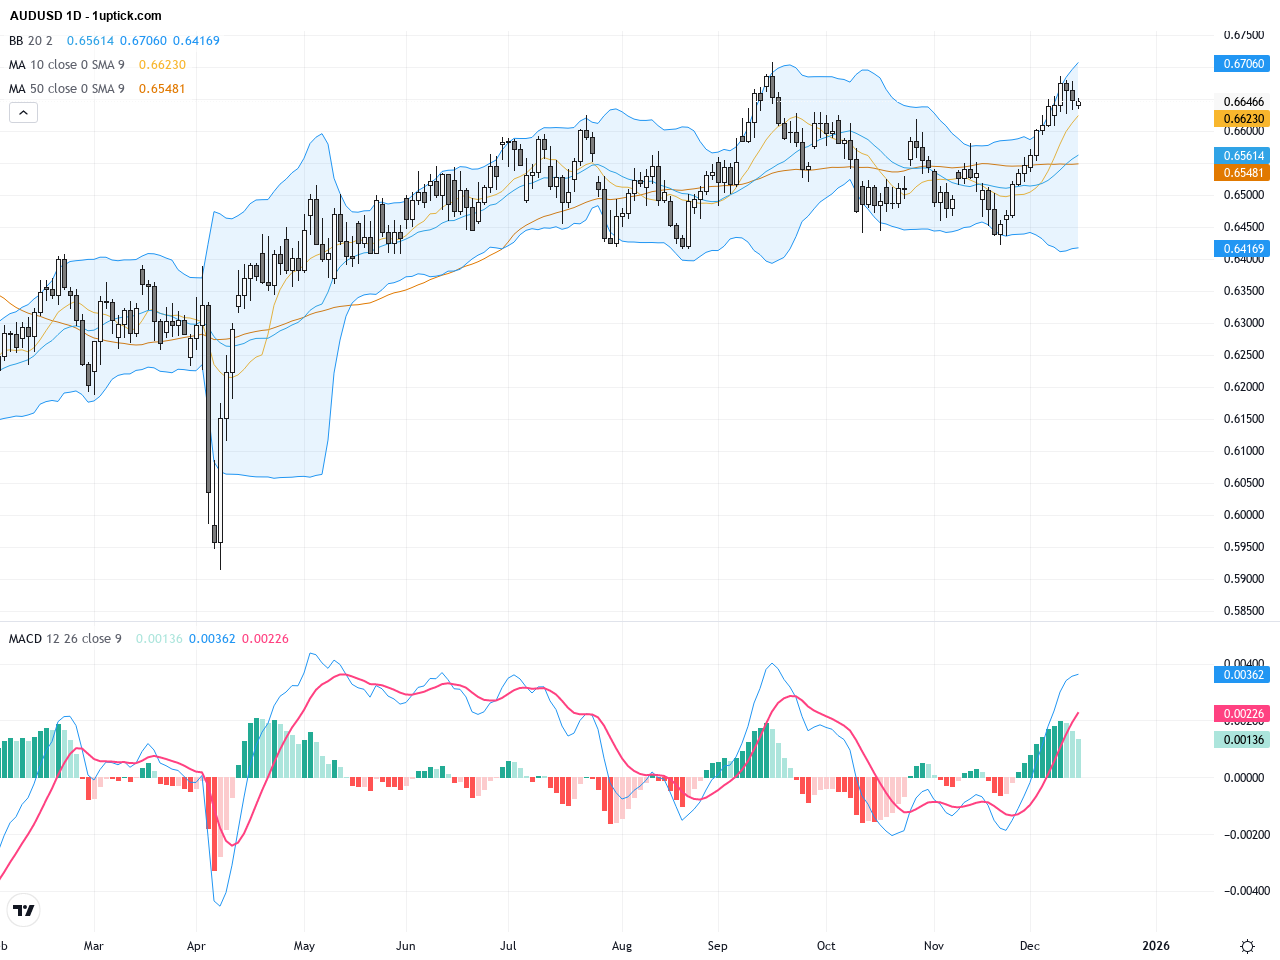
The daily chart reveals a steady upward trend for AUDUSD since the beginning of the year, with a recent breakout above a key trendline maintaining strength above 0.6600. The 50-day and 200-day moving averages show bullish alignment, supporting further price increases. Bollinger Bands indicate the price is near the upper band, suggesting possible short-term retracement risks. The MACD histogram remains in positive territory, indicating sustained bullish momentum overall.
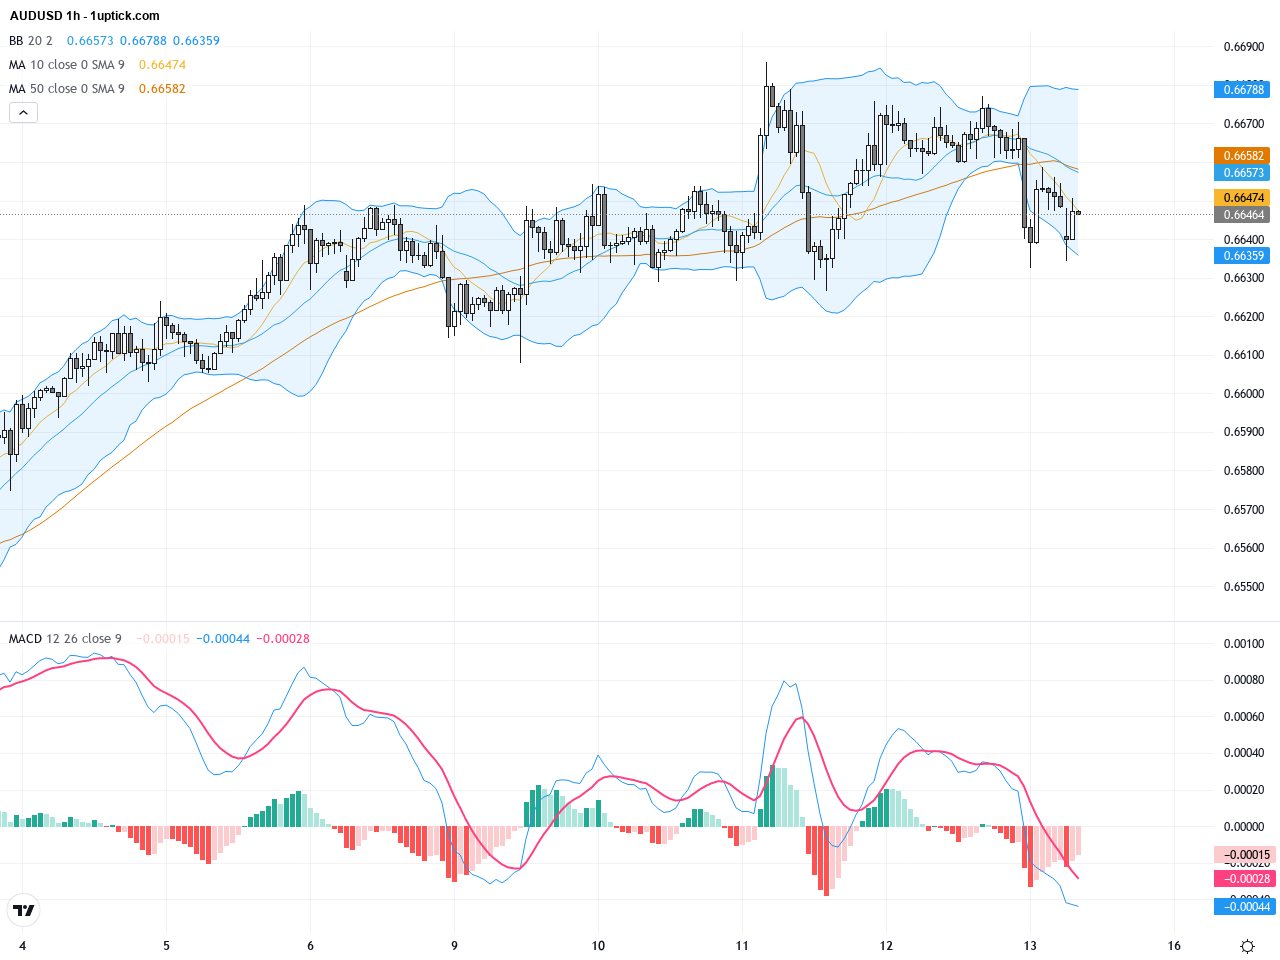
On the hourly chart, price volatility has been significant over the last 3 to 5 days, especially near resistance around 0.6650. Short-term moving averages show frequent crossovers, signaling increased volatility, but the MACD fast line recently crossed above the slow line, indicating a potential upward move. Bollinger Bands have tightened slightly, suggesting an imminent breakout. Short-term traders should closely monitor volume and key candlestick patterns for entry clues.
Technical Trend: AUDUSD is currently in a robust bullish trend with clear upward momentum.
Technically, AUDUSD has shown strong momentum after breaking a crucial yearly trendline, with MACD consistently trending above zero, indicating bullish strength. Both daily and hourly charts reflect a short-term bullish trend, with a prominent butterfly pattern suggesting potential testing of resistance around 0.6680 to 0.6700 within the next 24 hours. The price holding near the Bollinger Band edge confirms breakout confirmation. Traders should look for pullbacks as potential entry points to capitalize on this high-probability trade setup.There are no significant or direct economic events scheduled today that would impact AUDUSD. Market focus remains on upcoming Australian and US economic releases and monetary policy signals. Traders should continue monitoring central bank communications and macroeconomic news for further trend cues.
Resistance & Support

The above financial market data, quotes, charts, statistics, exchange rates, news, research, analysis, buy or sell ratings, financial education, and other information are for reference only. Before making any trades based on this information, you should consult independent professional advice to verify pricing data or obtain more detailed market information. 1uptick.com should not be regarded as soliciting any subscriber or visitor to execute any trade. You are solely responsible for all of your own trading decisions.