


 |
| Gold V.1.3.1 signal Telegram Channel (English) |

AUDUSD Technical & Fundamental Analysis: Bullish Consolidation Above 0.6600 Facing Key Resistance
2025-12-05 @ 19:16
Over the past 24 to 48 hours, the Australian Dollar against the US Dollar (AUD/USD) showed a steady upward trend, holding above the 0.6600 level and nearing a two-month high. Yesterday’s closing price was 0.66348, up from 0.66087 the previous day, marking an increase of about 0.39%. The key driver behind the recent surge is a series of strong Australian economic data, notably a surprising jump in household spending, which has boosted the attractiveness of the AUD.
The US Dollar weakened ahead of the highly anticipated US Personal Consumption Expenditures (PCE) inflation data release, the Federal Reserve’s preferred inflation gauge. The combination of a softer dollar and stronger Australian inflation signals has raised market expectations of a potential RBA rate hike next year, supporting the AUD/USD rally. The strengthening inflation pulse in Australia has led markets to reprice monetary policy expectations, further lifting the AUD.
For the average investor, this can be summarized as the Australian economy suddenly looking healthier with consumers spending more, boosting confidence among investors betting on an RBA rate hike. Meanwhile, the US Dollar’s cautious stance ahead of key data adds to the momentum favoring the Australian Dollar. In simple terms, positive Australian economic signals combined with US Dollar uncertainty have fueled the recent robust performance of AUD/USD.
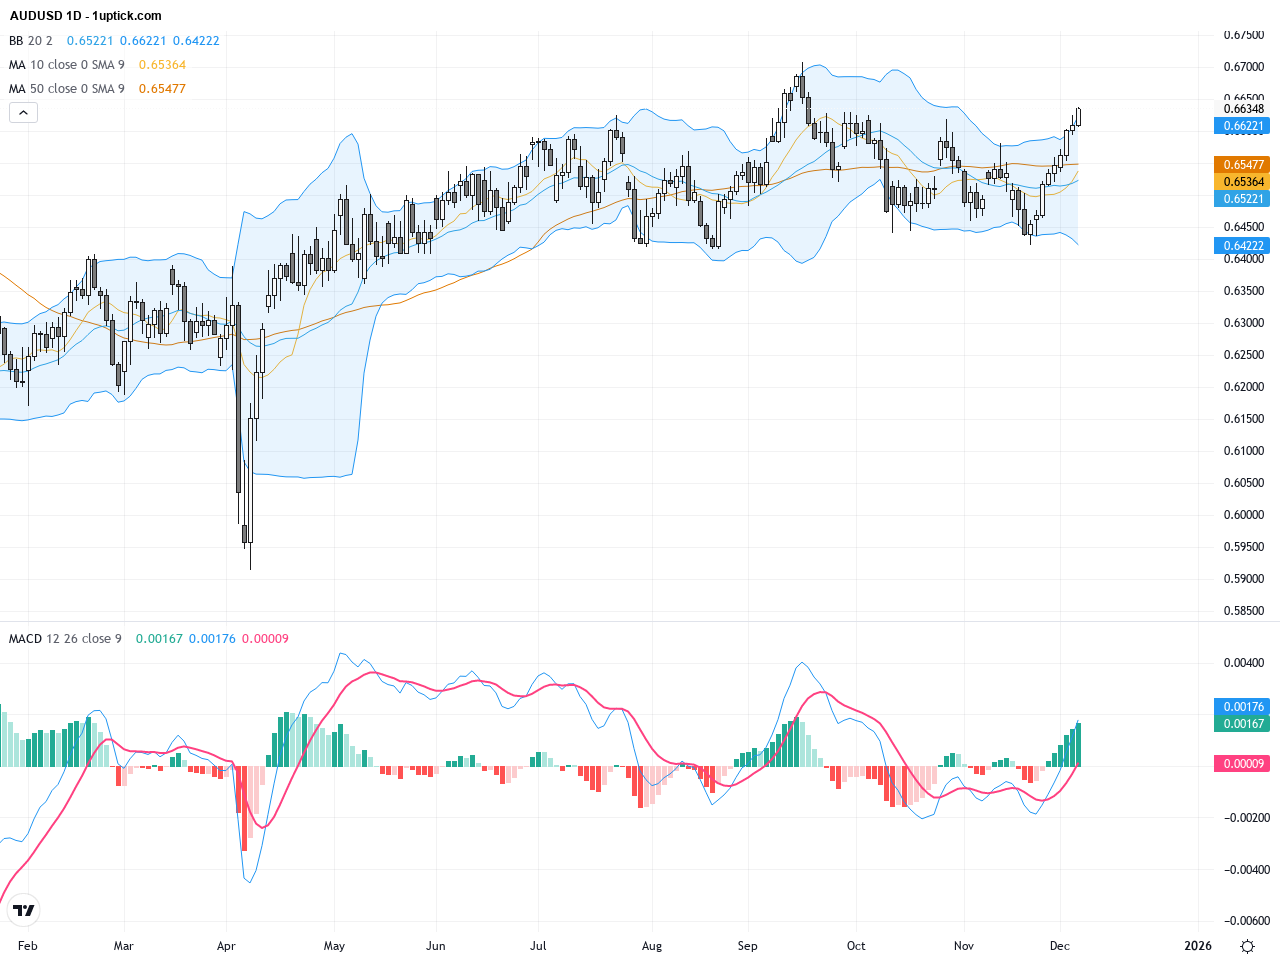
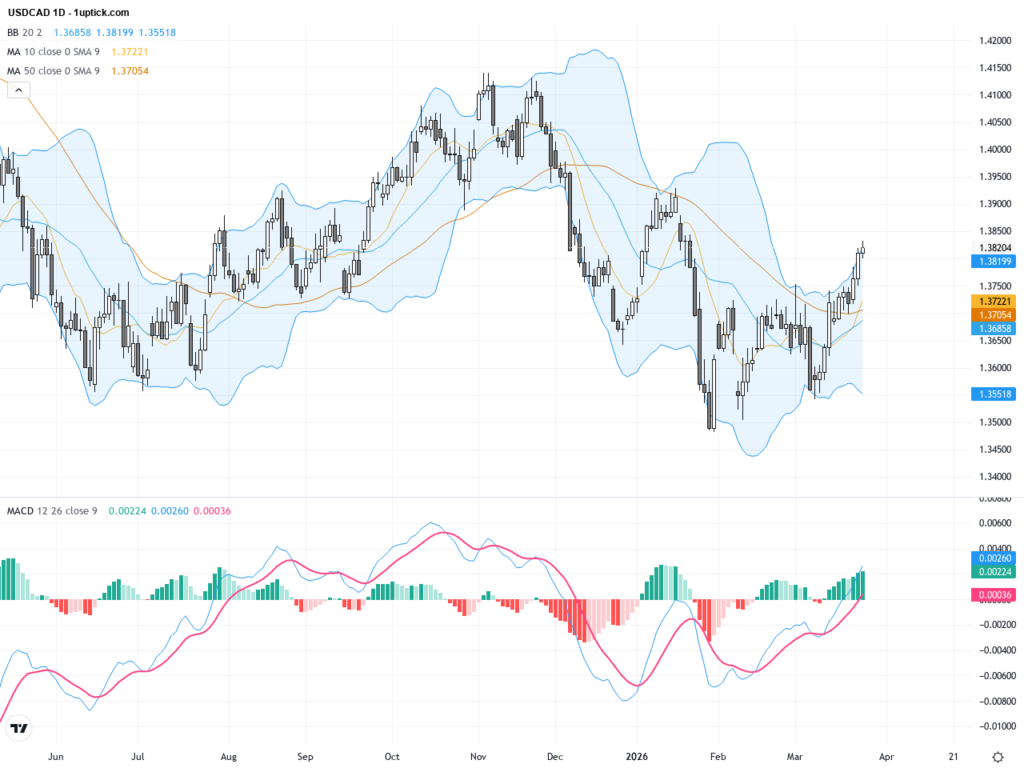
The daily chart reveals a gradual uptrend since the start of the month, with prices holding above the 50 and 200-day moving averages, confirming a medium to long-term bullish tone. Bollinger Bands are expanding with price near the upper band, indicating increased volatility. The MACD stays above zero, showing sustained positive momentum. The recent attempt to break higher from resistance points to a potential continuation of bullish momentum. However, any pullbacks may find support near 0.6550, aligned with moving averages.

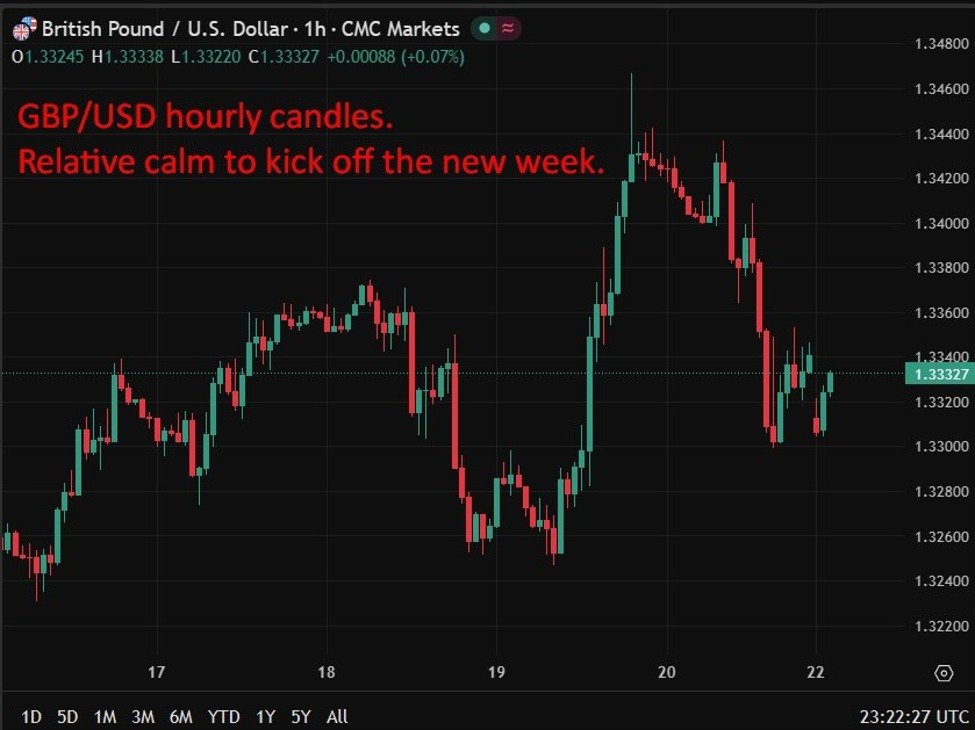
The hourly chart for the past 3-5 days shows AUDUSD consolidating within a tight range between 0.6600 and 0.6650. Short-term moving averages have formed a golden cross, but the Bollinger Bands have contracted, and the MACD momentum is weakening, suggesting a pause in bullish momentum. The formation of a bearish engulfing candlestick indicates possible short-term pullback or sideways action. Overall, the trend remains bullish, awaiting guidance from the upcoming US PCE data.
Technical Trend: The current AUDUSD trend is cautiously bullish and consolidative, showing a mild upward trajectory waiting for key data-driven confirmation.
Technical insights show AUDUSD maintaining bullish dominance on the daily chart with moving averages and MACD supporting the trend. The bearish engulfing candlestick on the hourly chart cautions of short-term consolidation. Volume and momentum indicators suggest a potential pause before a decisive breakout. Traders should closely monitor the US PCE data and watch if the price can break and hold above the critical 0.6650 resistance level.Today’s key economic events revolve around Europe and the US, with primary relevance to AUDUSD being the US Personal Consumption Expenditures (PCE) and core PCE releases at 14:30 GMT+1. Since PCE is a preferred inflation gauge for the Federal Reserve, the data will significantly influence USD strength and thus AUDUSD price movements. A stronger-than-expected PCE could bolster the dollar and pressure AUDUSD down, while a weaker print may support further AUD gains. Other global data today are unlikely to have direct notable impact on AUDUSD.
Resistance & Support

<
p style=”padding: 10px; margin: 20px 0; border: solid 1px #fa003f; border-radius: 5px;”>The above financial market data, quotes, charts, statistics, exchange rates, news, research, analysis, buy or sell ratings, financial education, and other information are for reference only. Before making any trades based on this information, you should consult independent professional advice to verify pricing data or obtain more detailed market information. 1uptick.com should not be regarded as soliciting any subscriber or visitor to execute any trade. You are solely responsible for all of your own trading decisions.