


 |
| Gold V.1.3.1 signal Telegram Channel (English) |
AUDUSD: Testing Yearly High with Key Technical Patterns and Trading Outlook
2025-12-12 @ 08:01
Over the past 24 to 48 hours, the Australian Dollar against the US Dollar (AUD/USD) experienced notable volatility, climbing from yesterday’s closing price of 0.66617 to approach its yearly high of 0.67071. During this period, the AUD showed remarkable resilience by quickly bouncing back after a disappointing Australian November jobs report.
Specifically, employment declined by 21,300 in November, missing expectations for a modest increase, which initially triggered selling pressure. However, the Reserve Bank of Australia (RBA) kept interest rates steady and signaled inflation risks, while the US Federal Reserve delivered its final rate cut of the year, weakening the US Dollar. These factors combined to provide strong support for the AUD, driving its price upward sharply toward the yearly peak.
For the average investor, this illustrates that even when fundamental data takes a hit, currencies can rebound strongly due to shifts in monetary policy and global risk sentiment. The strengthening AUD indicates that amid a weaker USD environment, investors are repositioning their portfolios towards more attractive assets, highlighting the importance of monitoring central bank policies and economic indicators for their broader market impact.

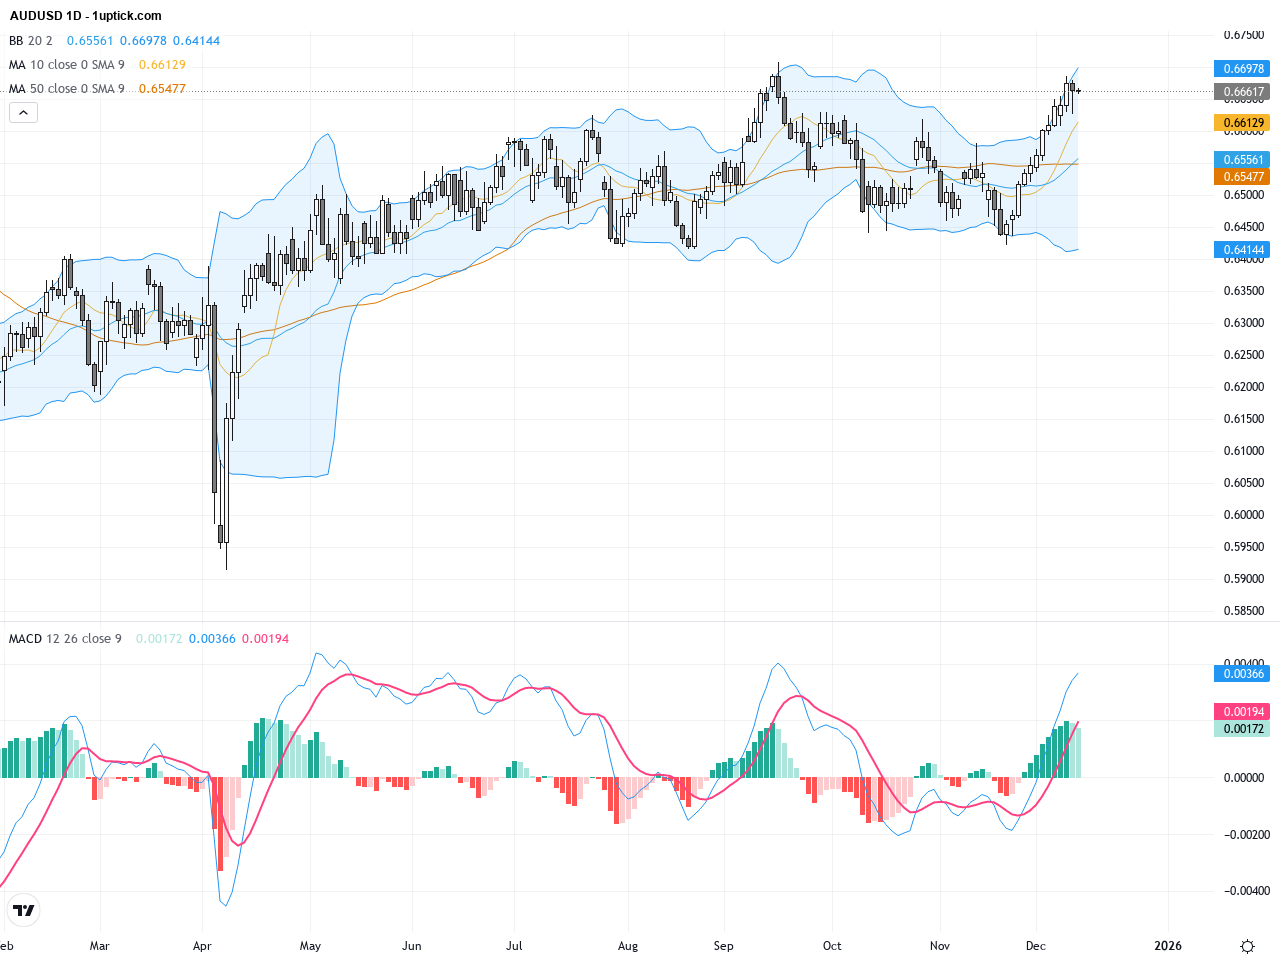
The daily chart shows AUDUSD steadily climbing from recent lows, trading above medium-term moving averages indicating a strong bullish trend. Bollinger Bands have contracted before expanding upward, signaling increasing volatility with clear upward momentum. The MACD histogram is growing with the fast line above the slow line, confirming upward momentum. The pair is nearing yearly high resistance at 0.6707, signaling short-term overbought conditions requiring caution for possible pullbacks.
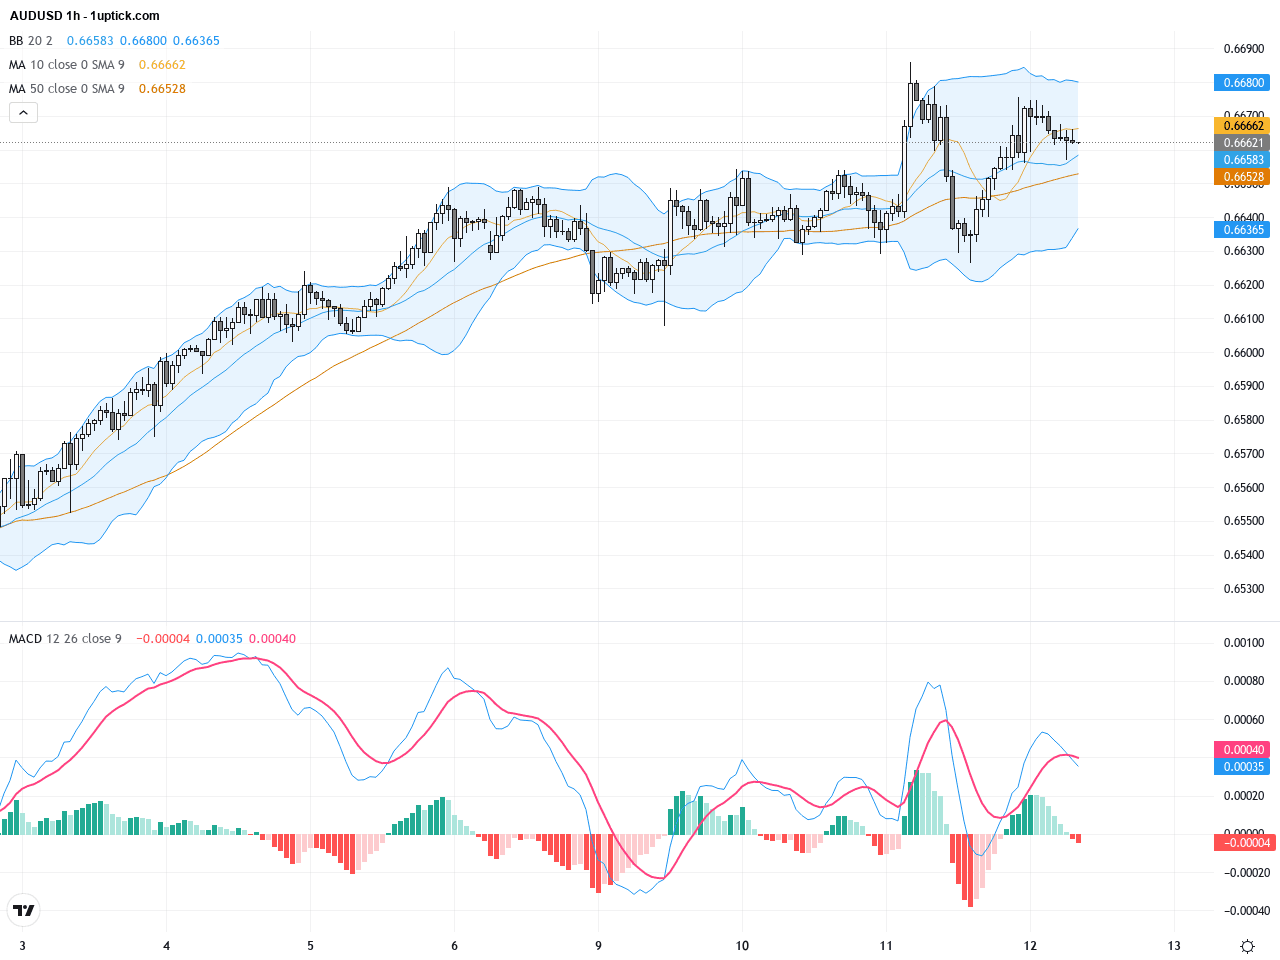
On the hourly chart, AUDUSD exhibits a consolidating uptrend with moving averages aligned bullishly. Price action near the upper Bollinger Band faces resistance and pullbacks, while MACD is forming a bullish crossover indicating strengthening short-term momentum. A flag pattern has developed over the past 3-5 days; a breakout above the upper band could trigger a significant rally, though watch for potential short-term reversal candlesticks as well.
Technical Trend: Cautiously bullish with a predominant fluctuating upward trend.
Technically, AUDUSD remains in a clear uptrend supported by daily MACD, moving averages, and Bollinger Bands. The hourly flag consolidation breakout could offer a prime entry point for short to medium-term trades. While weak Australian jobs data caused short-lived weakness, USD softness and RBA’s hawkish signals extend the bullish case. The 0.6707 yearly high is a critical resistance level to watch for potential trend continuation.Today’s economic calendar shows no high-priority events directly impacting AUDUSD. Chinese new loans and M2 data releases are on tap but expected to have limited immediate effect. Australia’s leading indicators will be released later, providing economic trend insight but likely little short-term market disruption. Traders should focus on market sentiment and USD movements today.
Resistance & Support

The above financial market data, quotes, charts, statistics, exchange rates, news, research, analysis, buy or sell ratings, financial education, and other information are for reference only. Before making any trades based on this information, you should consult independent professional advice to verify pricing data or obtain more detailed market information. 1uptick.com should not be regarded as soliciting any subscriber or visitor to execute any trade. You are solely responsible for all of your own trading decisions.