


 |
| Gold V.1.3.1 signal Telegram Channel (English) |
EURUSD Technical Analysis: Key Patterns and Market News Driving the Price
2025-12-15 @ 08:01
Over the past 24 to 48 hours, EUR/USD remained steady around the 1.1740 level, showing minor fluctuations compared to yesterday’s closing price of 1.17373. The market exhibited caution as investors awaited policy signals from the Federal Reserve. Goldman Sachs’ recent forecast that the dollar may resume its slide has been a key factor supporting the euro’s strength.
Recent dovish comments from Federal Reserve officials suggesting a pause in rate hikes have reinforced EUR/USD’s stability. Additionally, the euro briefly surged past the 1.18 mark, nearing a two-and-a-half-month high, reflecting optimism over European economic data and investors adjusting their dollar positions.
For everyday investors, this means reduced volatility in the EUR/USD pair as the market looks for clearer directional cues. With the dollar potentially retreating due to paused rate hikes and the euro benefiting from relatively strong European economic performance, the scenario provides a solid reference for short- to medium-term trading and investment strategies.

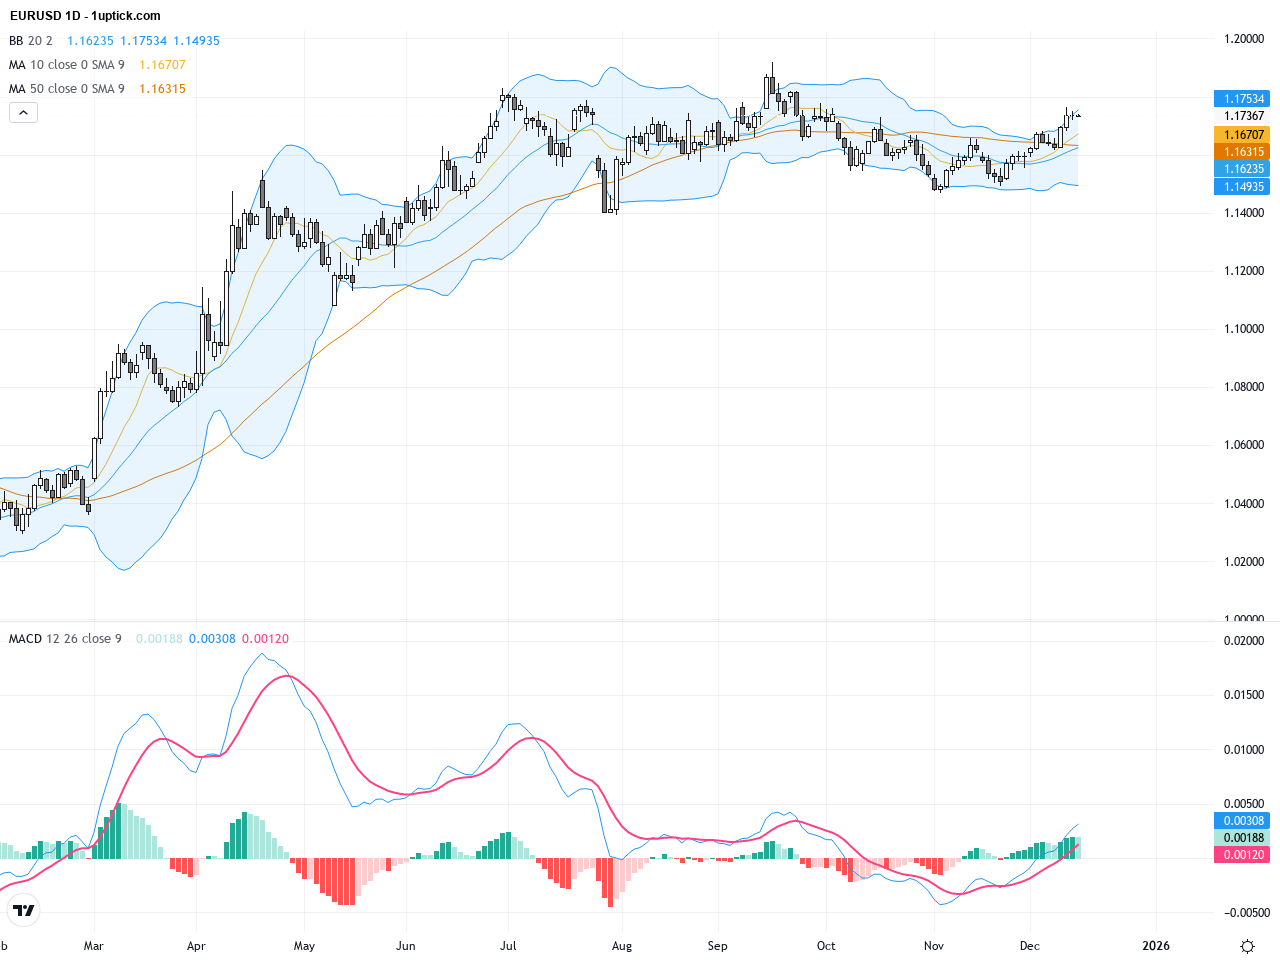
The daily chart reveals an overall upward trend over the past weeks, with EURUSD repeatedly testing and pulling back near the yearly high of 1.19188. The price currently consolidates between 1.17 and 1.18. The 50-day and 200-day moving averages have formed a golden cross, confirming bullish momentum over the medium to long term. Bollinger Bands show a narrowing range, indicating a potential breakout. The MACD histogram shows momentum slowing but remains in positive territory, signaling a stable trend.
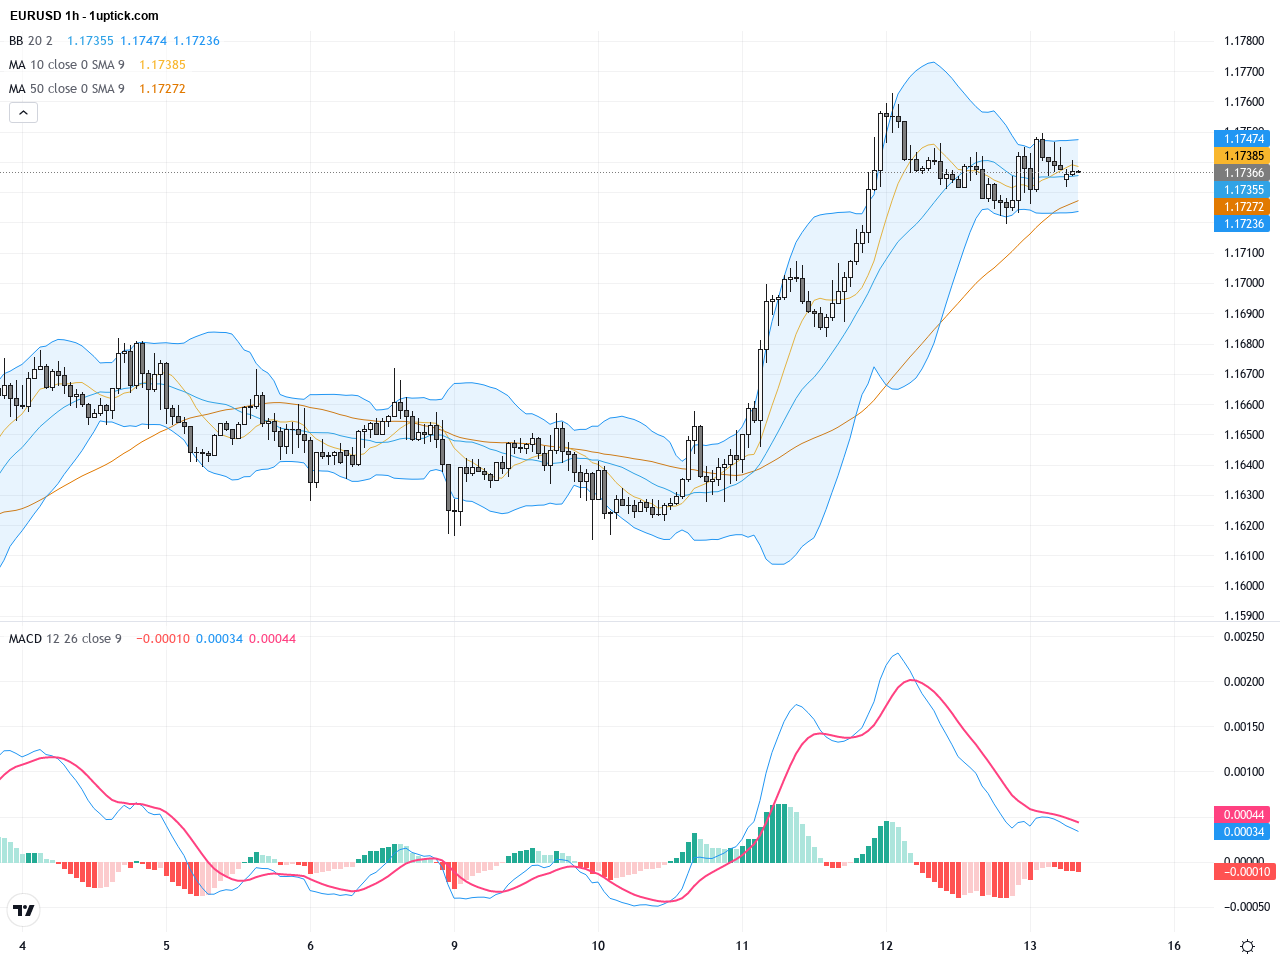
The hourly chart over the last 5 trading days shows strong oscillations between 1.1650 and 1.1750, with short-term moving averages in a tug of war between bulls and bears. Bollinger Bands are expanding, reflecting increased volatility. A recent MACD bullish crossover hints at strengthening short-term bullish momentum. Notably, the latest candles formed a bullish engulfing pattern signaling a possible upward move over the next 24 hours, though resistance levels need to be watched closely.
Technical Trend: Cautiously Bullish Trend
Technical analysis indicates EURUSD remains in a stable bullish trend with daily golden cross and tightening Bollinger Bands suggesting a potential breakout soon. The hourly bullish MACD crossover and bullish engulfing pattern support short-term upside momentum. Traders should watch the key resistance at 1.1823, which, if broken decisively, could trigger a further rally. Conversely, failing to hold support at 1.1650 might lead to a short-term pullback.There are no significant or direct economic events scheduled today that would impact EURUSD. The price action is expected to be driven primarily by prevailing market news and technical signals, with traders focusing on sentiment and technical setups.
Resistance & Support

The above financial market data, quotes, charts, statistics, exchange rates, news, research, analysis, buy or sell ratings, financial education, and other information are for reference only. Before making any trades based on this information, you should consult independent professional advice to verify pricing data or obtain more detailed market information. 1uptick.com should not be regarded as soliciting any subscriber or visitor to execute any trade. You are solely responsible for all of your own trading decisions.