


 |
| Gold V.1.3.1 signal Telegram Channel (English) |

GBPUSD Technical & Fundamental Analysis: Key Support and Resistance Amid UK Growth Concerns
2025-12-12 @ 08:02
Over the past 24 to 48 hours, GBP/USD experienced notable volatility, initially driven by the US Federal Reserve’s (Fed) interest rate cut and a wait-and-see stance that weakened the US dollar broadly, pushing the British pound above the 1.34 mark. The previous closing price was around 1.3393, reflecting recent market moves where the dollar’s pressure due to Fed’s rate cut and softer US jobs data triggered a rebound in the pound.
However, the pound’s rally faces headwinds. There are growing concerns about the UK’s economic growth prospects, especially with the slowdown in the labor market, which has dented investor confidence in the pound. Additionally, the pound weakened against the euro as the euro benefited from the US dollar’s softness, limiting the pound’s gains.
For the average investor, these market movements highlight how sensitive currency pairs are to global economic policies. The Fed’s rate cut and fluctuating economic data have clouded the dollar’s direction, creating short-term opportunities for the pound. But attention should remain on the UK’s domestic economic indicators, especially labor market health, as these will directly impact the pound’s future trajectory.

The daily chart shows GBPUSD in a slightly bullish consolidation phase. The pair has rebounded since the beginning of the year, repeatedly facing resistance near the 200-day moving average at 1.3402, while staying above the 50-day moving average of 1.32257. The Bollinger Bands are tightening, indicating decreasing volatility, while the MACD remains positive but with weakening momentum, suggesting a possible pause in the uptrend and a potential continuation of the consolidation phase.
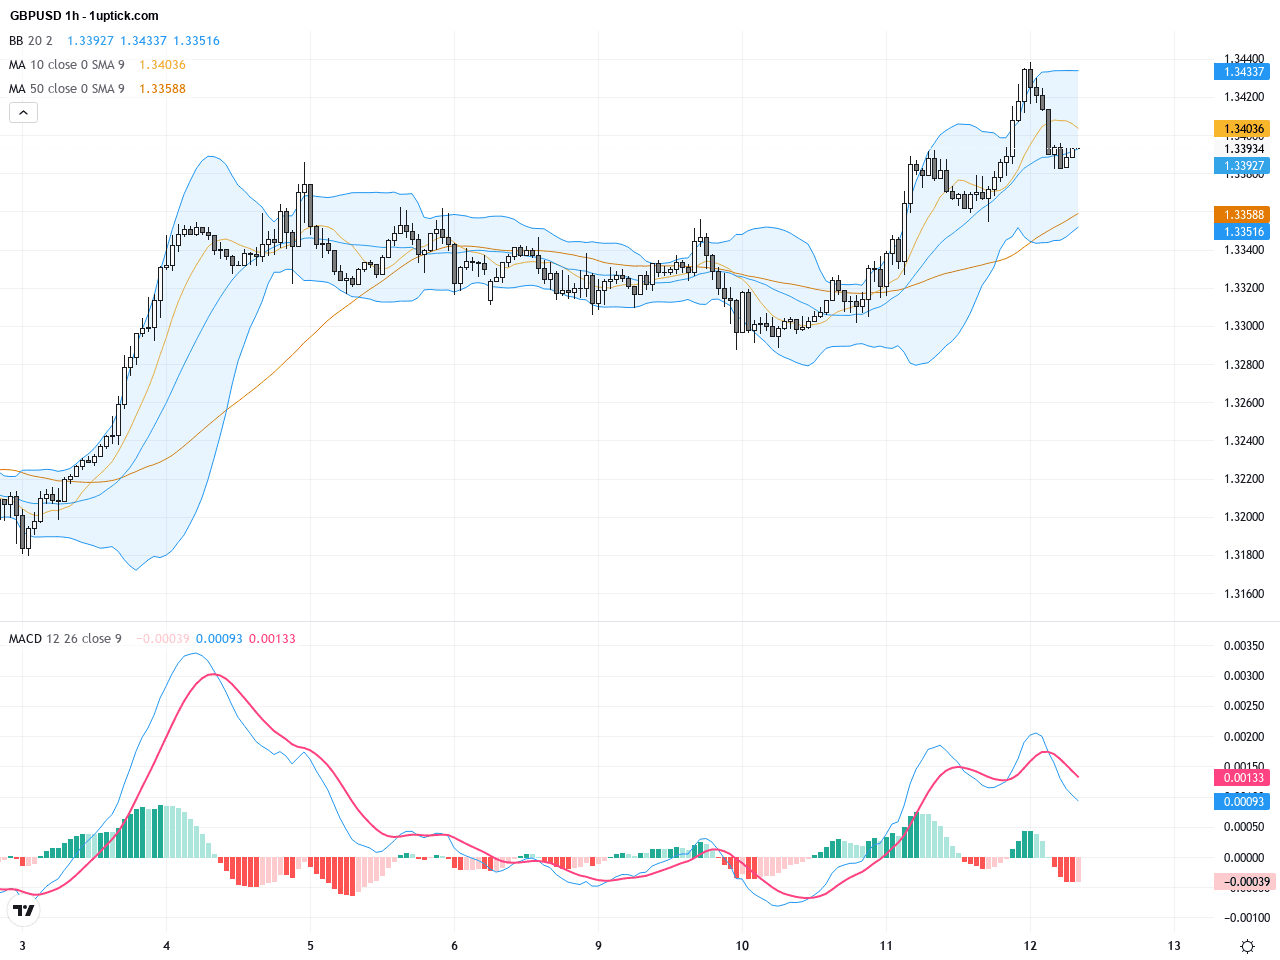
The hourly chart over the past 3 to 5 days reveals heightened volatility with prices oscillating between 1.337 and 1.342. Recently, the price broke above the 20 EMA but is encountering resistance at the 21 EMA. The MACD has formed a bullish crossover, signaling short-term upside potential. Bollinger Bands are slightly widening, implying the possibility of a trending move continuation. However, volume remains muted, calling for cautious trading on short-term swings.
Technical Trend: GBPUSD is currently in a cautiously bullish consolidation phase, with market sentiment swayed by economic data and USD fluctuations, leading to heightened volatility and uncertainty for traders.
Technically, the daily MACD’s diminishing momentum suggests caution, while the hourly MACD bullish crossover indicates short-term buying opportunities. The pair remains just below the 200-day MA, a key resistance level. The main challenge will be whether GBPUSD can sustain a breakout above this resistance; failure to do so could see a retracement. A recent bearish engulfing candlestick highlights short-term volatility, emphasizing the importance of monitoring key support areas before making entries.Today at 08:00 GMT+1, the UK will release its October GDP monthly and yearly growth figures, forecasted at 0.1% m/m and 1.4% y/y respectively. Given the current concerns over UK economic growth, a better-than-expected reading could bolster GBPUSD, while a disappointing number may exacerbate downside pressure. Other global economic events today are unlikely to have a direct impact on GBPUSD, focusing market attention squarely on UK data.
Resistance & Support

The above financial market data, quotes, charts, statistics, exchange rates, news, research, analysis, buy or sell ratings, financial education, and other information are for reference only. Before making any trades based on this information, you should consult independent professional advice to verify pricing data or obtain more detailed market information. 1uptick.com should not be regarded as soliciting any subscriber or visitor to execute any trade. You are solely responsible for all of your own trading decisions.