


 |
| Gold V.1.3.1 signal Telegram Channel (English) |
USDCAD Technical & Fundamental Analysis: Canadian Dollar Bullish Momentum Shapes Key Resistance Levels
2025-12-09 @ 08:01
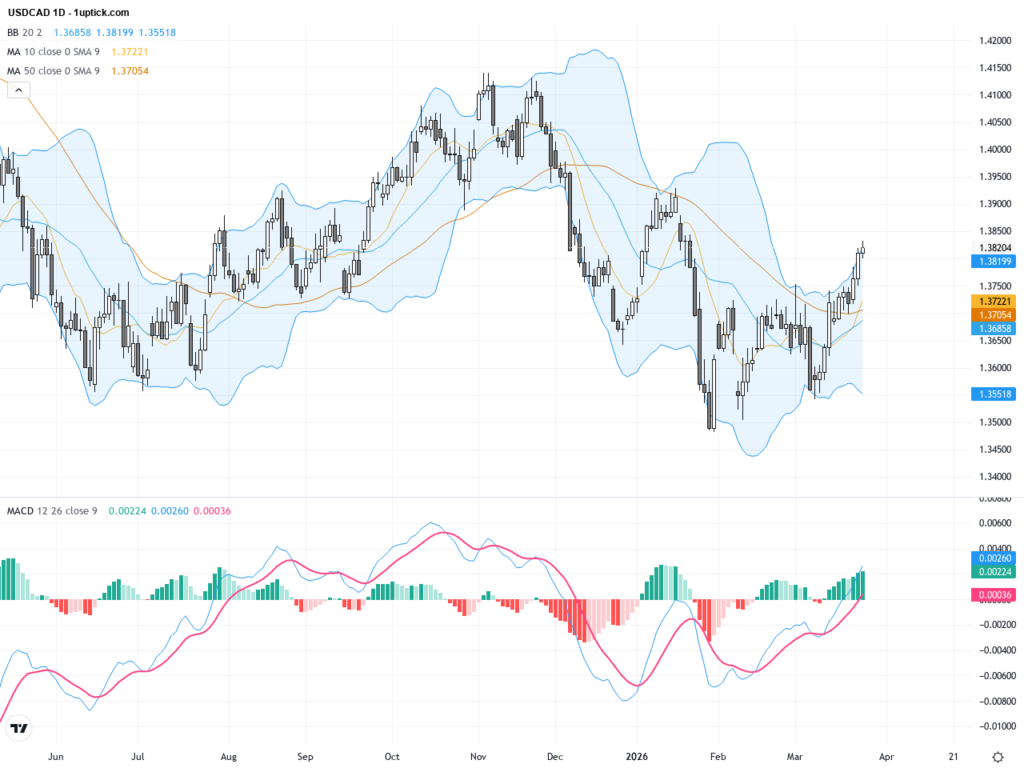
Over the past 48 hours, USD/CAD has shown noticeable volatility, with the exchange rate slipping slightly from yesterday’s close near 1.38487 and hovering around the 1.38 mark. Following the release of robust Canadian employment data and widespread market expectations that the Bank of Canada (BoC) will hold its interest rates steady, the Canadian dollar strengthened, putting pressure on the USD/CAD pair. Investors are also closely watching the upcoming Federal Reserve (Fed) and BoC policy meetings for further guidance on economic outlook and interest rate trajectories.
Economist David Rosenberg has turned ‘outright bullish’ on the Canadian dollar, forecasting USD/CAD to gradually fall from the current level of around 1.38 to 1.30 by 2026, reflecting optimism about the CAD’s long-term prospects. For investors, this signals ongoing downside pressure on the pair amid contrasting US and Canadian economic policies and improving Canadian fundamentals. The recent strong Canadian job market data has effectively countered the USD’s relative strength, making the coming central bank decisions pivotal for USD/CAD direction.

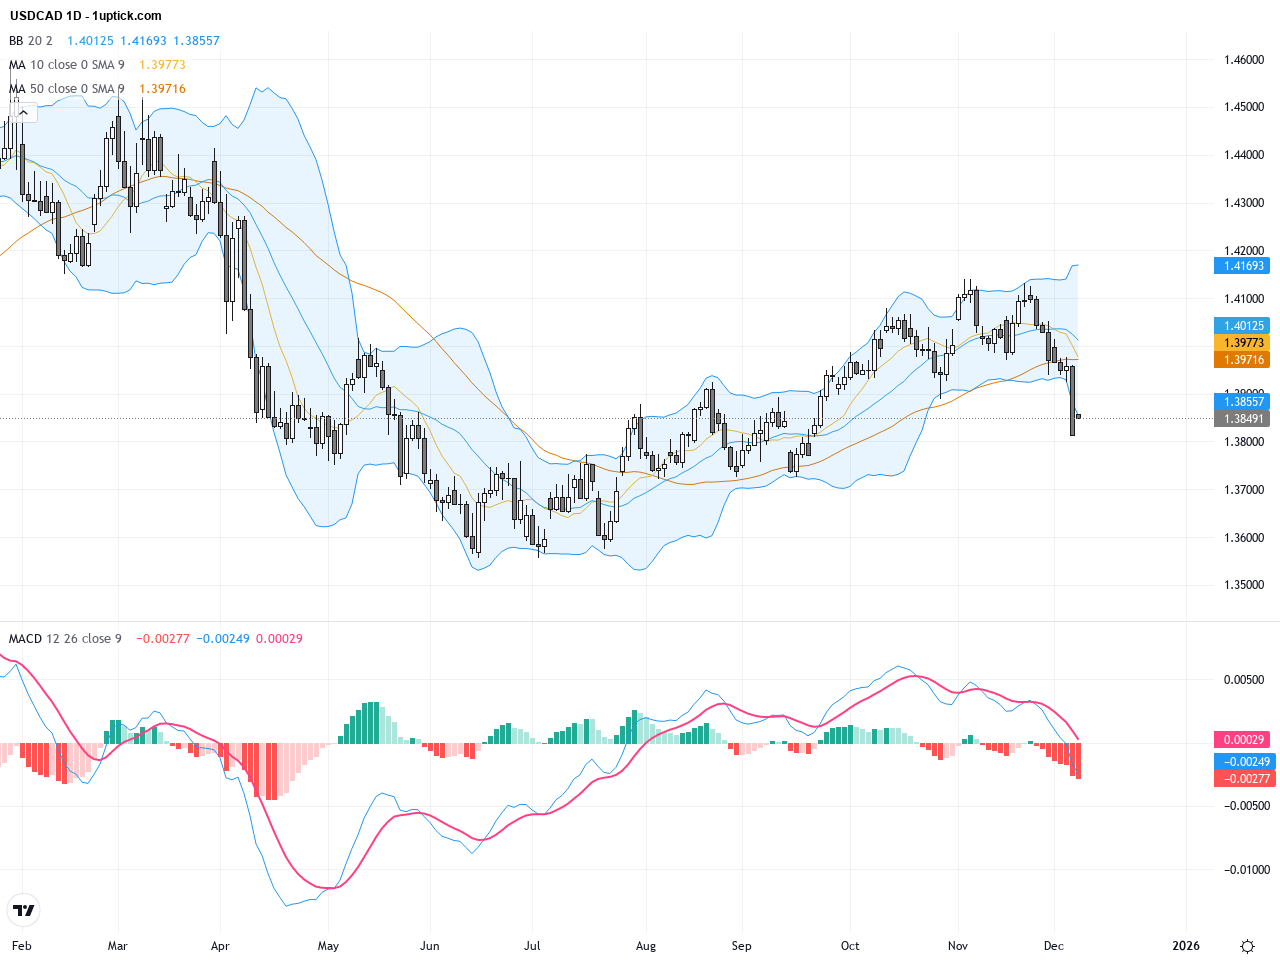
The daily chart reveals that USDCAD recently found support around 1.38 and is attempting to break above the mid-term moving average near 1.38 but remains below the 50-day moving average, indicating short-term resistance. Bollinger Bands are contracting, signaling reduced volatility, while the MACD shows a negative region with signs of gradual recovery. The trend is consolidative with a slight bearish bias, necessitating attention to key support and resistance levels for future breakout direction.
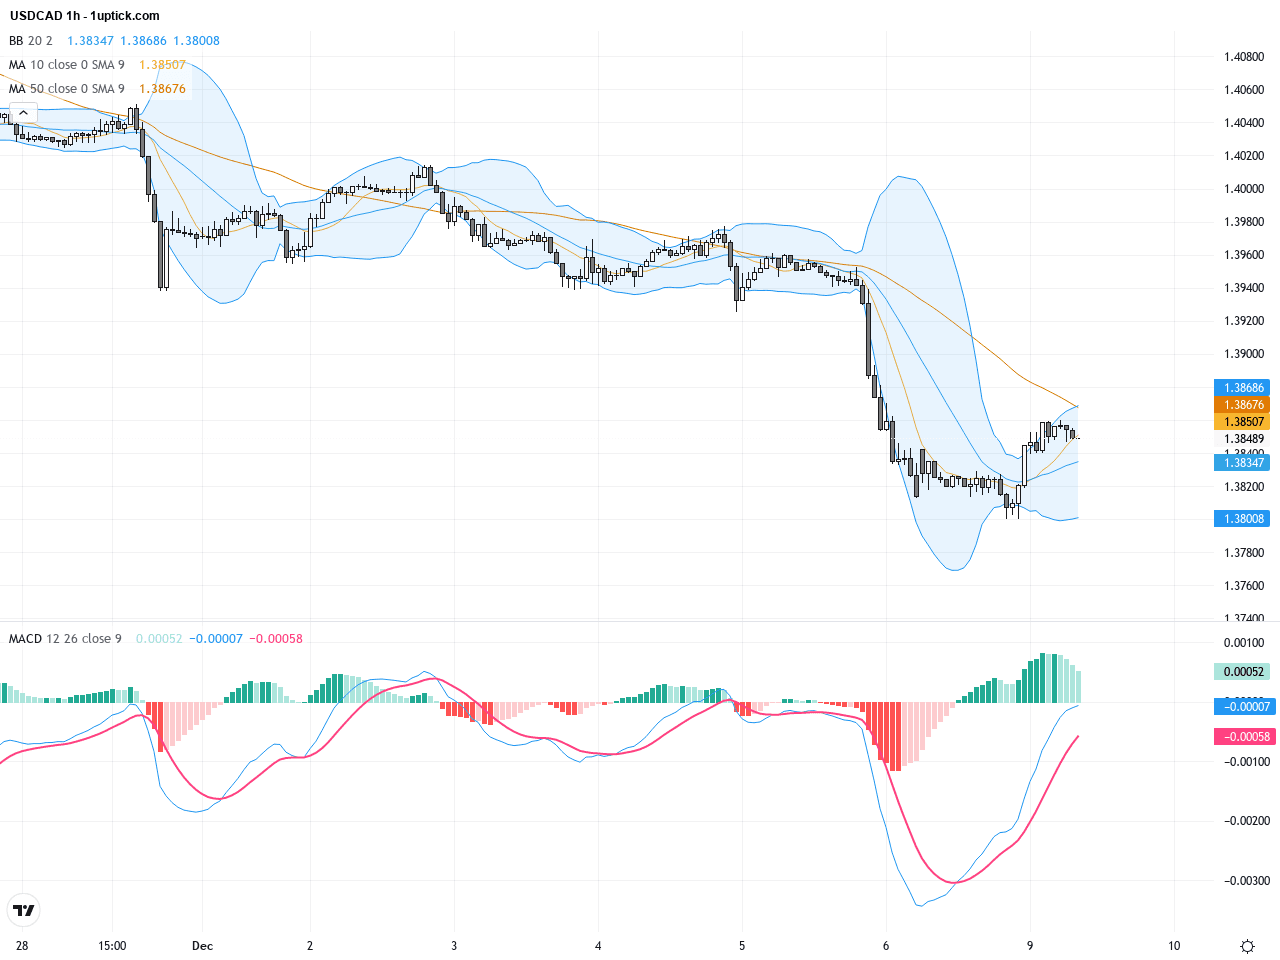
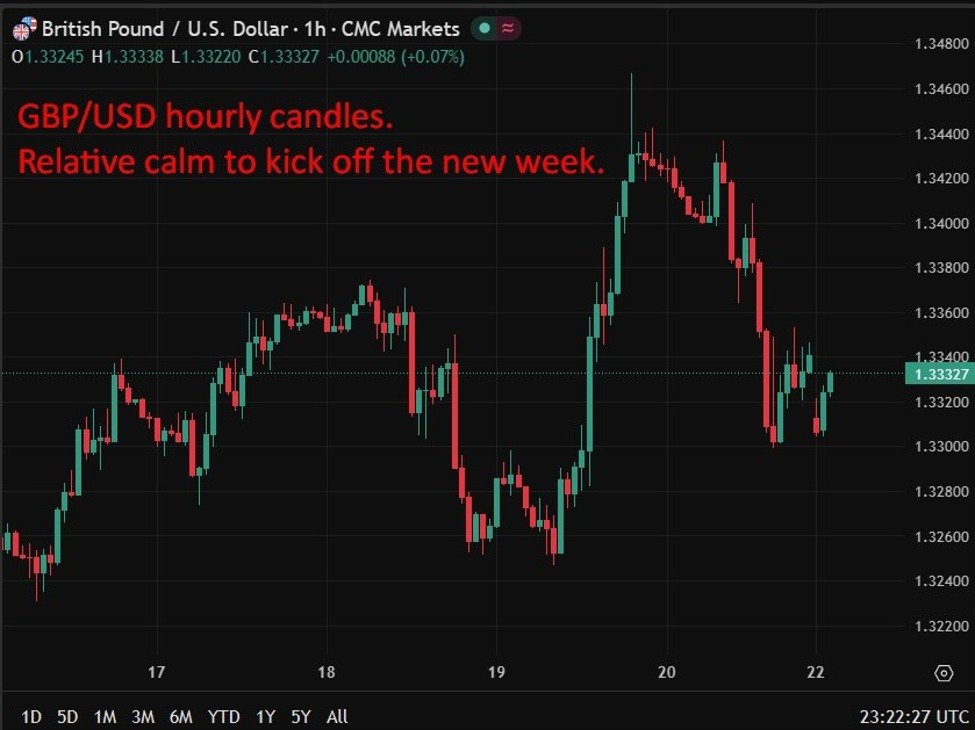
On the hourly chart for the past 3-5 days, USDCAD is oscillating in the 1.38 to 1.385 range with a bearish short-term sentiment. Short-term moving averages have formed a death cross, and volume remains steady. The MACD histogram is shrinking, indicating weakening momentum without a clear reversal signal. Recent candlestick patterns show several small doji candles, reflecting an intense battle between buyers and sellers and suggesting a continued sideways consolidation in the near term.
Technical Trend: USDCAD is currently in a cautiously consolidative state with a neutral to slightly bullish overall trend. Technical and fundamental cues support Canadian dollar strength, suggesting a cautiously bullish outlook.
Technically, USDCAD is trading near a crucial support zone. If the daily MACD continues to recover and Bollinger Bands start to widen, it could trigger a new upward movement. The hourly chart’s candlestick signals combined with momentum indicators suggest that an increase in trading volume could validate a trend reversal. Currently, the prominent pattern is a horizontal triangle formed by a stable low, hinting at a potential breakout soon.Today’s GMT+1 economic calendar shows no direct events impacting USDCAD. Key interest rate decisions for Canada and the U.S. have no updates, and important employment or wage data are not scheduled. Therefore, market attention will likely focus on other global data, rendering minimal short-term impact on USDCAD.
Resistance & Support

The above financial market data, quotes, charts, statistics, exchange rates, news, research, analysis, buy or sell ratings, financial education, and other information are for reference only. Before making any trades based on this information, you should consult independent professional advice to verify pricing data or obtain more detailed market information. 1uptick.com should not be regarded as soliciting any subscriber or visitor to execute any trade. You are solely responsible for all of your own trading decisions.