


 |
| Gold V.1.3.1 signal Telegram Channel (English) |
USDCAD Technical & Fundamental Analysis: Oil Rally Strengthens Loonie Ahead
2025-12-23 @ 08:02
Over the past 24 to 48 hours, USDCAD (US Dollar to Canadian Dollar) has seen notable volatility, closing at 1.37495 over the weekend. The market reflected a weakening US Dollar alongside rising oil prices that strongly supported the Canadian Dollar. The ongoing rally in oil prices, driven by supply disruption fears, boosted this commodity-linked currency and pressured the USDCAD pair lower.
Recent market news highlights how the rebound in oil prices directly fueled buying momentum in the Canadian Dollar. Given Canada’s economy is heavily reliant on energy exports, the oil price surge signals stronger fundamentals, making the Canadian Dollar more attractive. Coupled with softer inflation data from the US and expectations of looser US monetary policy, the US Dollar faced pressure, resulting in a decline in USDCAD.
For the average investor, this movement is like a Canada’s economy-powered car gaining strength with rising oil as fuel while the US Dollar engine weakens. Looking ahead, with Canadian GDP data on the horizon, the market will be closely watching whether economic performance can sustain the Canadian Dollar’s strength, while the US Dollar remains under pressure.

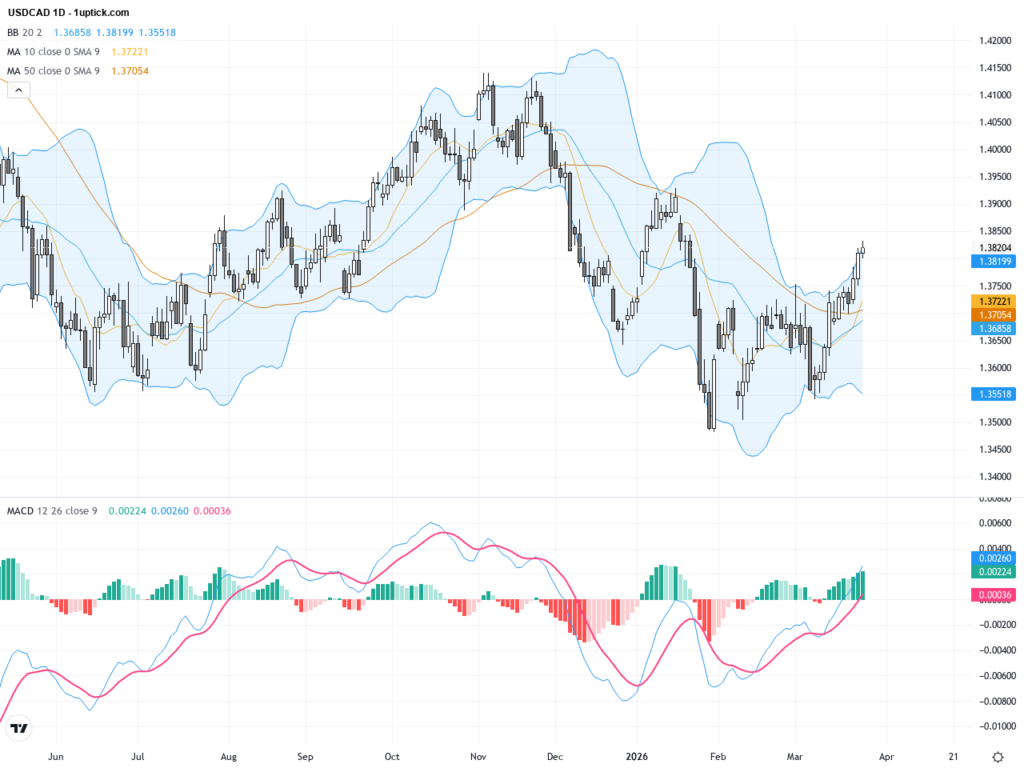
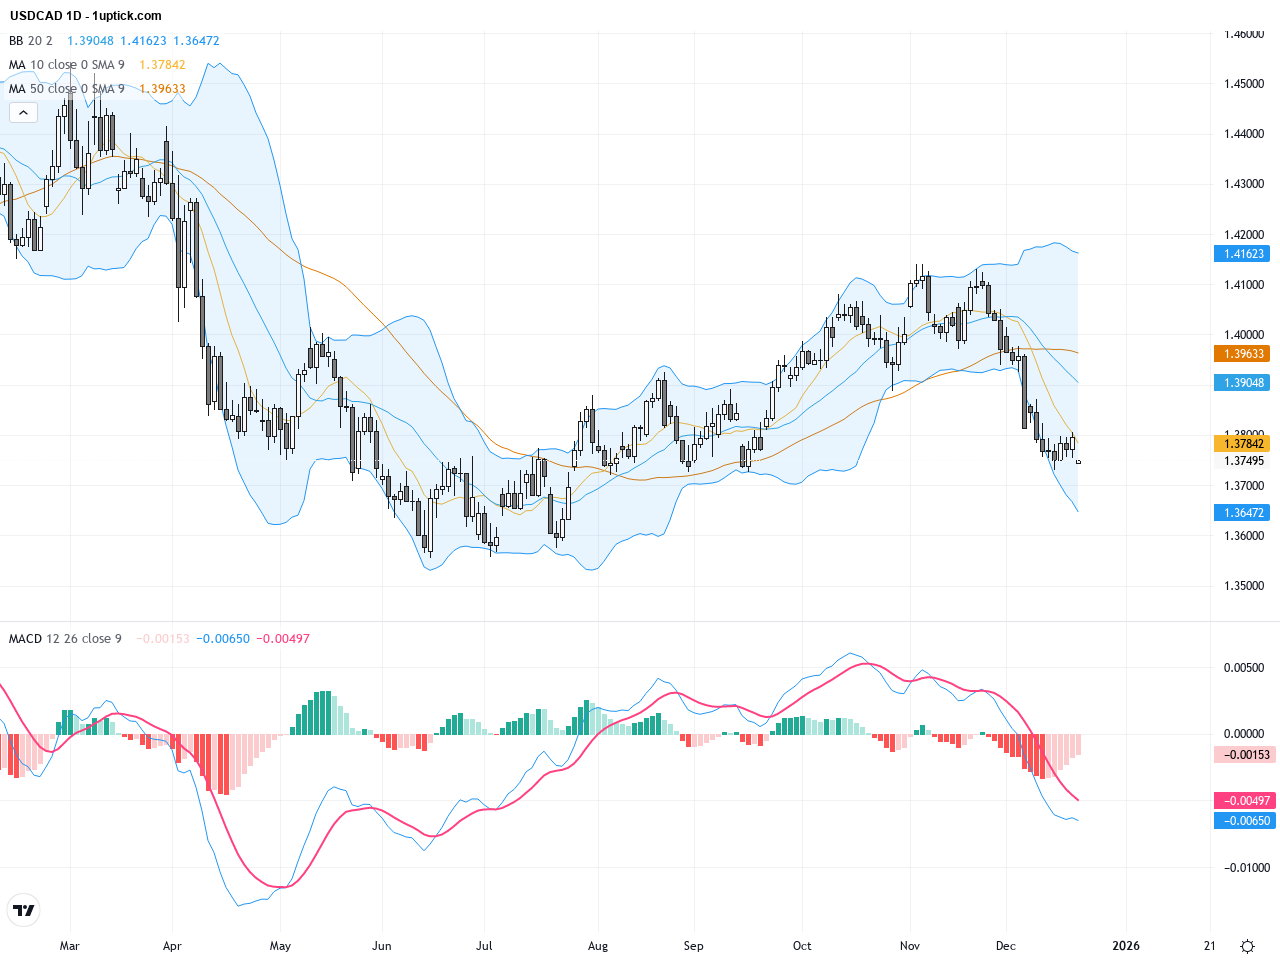
The USDCAD daily chart reveals recent price movements oscillating between 1.37 and 1.39, indicating a short-term consolidation phase. The 30-day and 50-day moving averages are intertwined, signaling balanced bullish and bearish forces. The price has tested support near the Bollinger Bands midline several times, suggesting underlying buying interest. The MACD indicator shows a slight decrease in momentum with narrowing histogram bars but no clear reversal signal yet. The overall trend shows mild downward pressure but still a possibility for rebounds. Monitoring moving average crossovers will be key to confirming the medium-term trend.
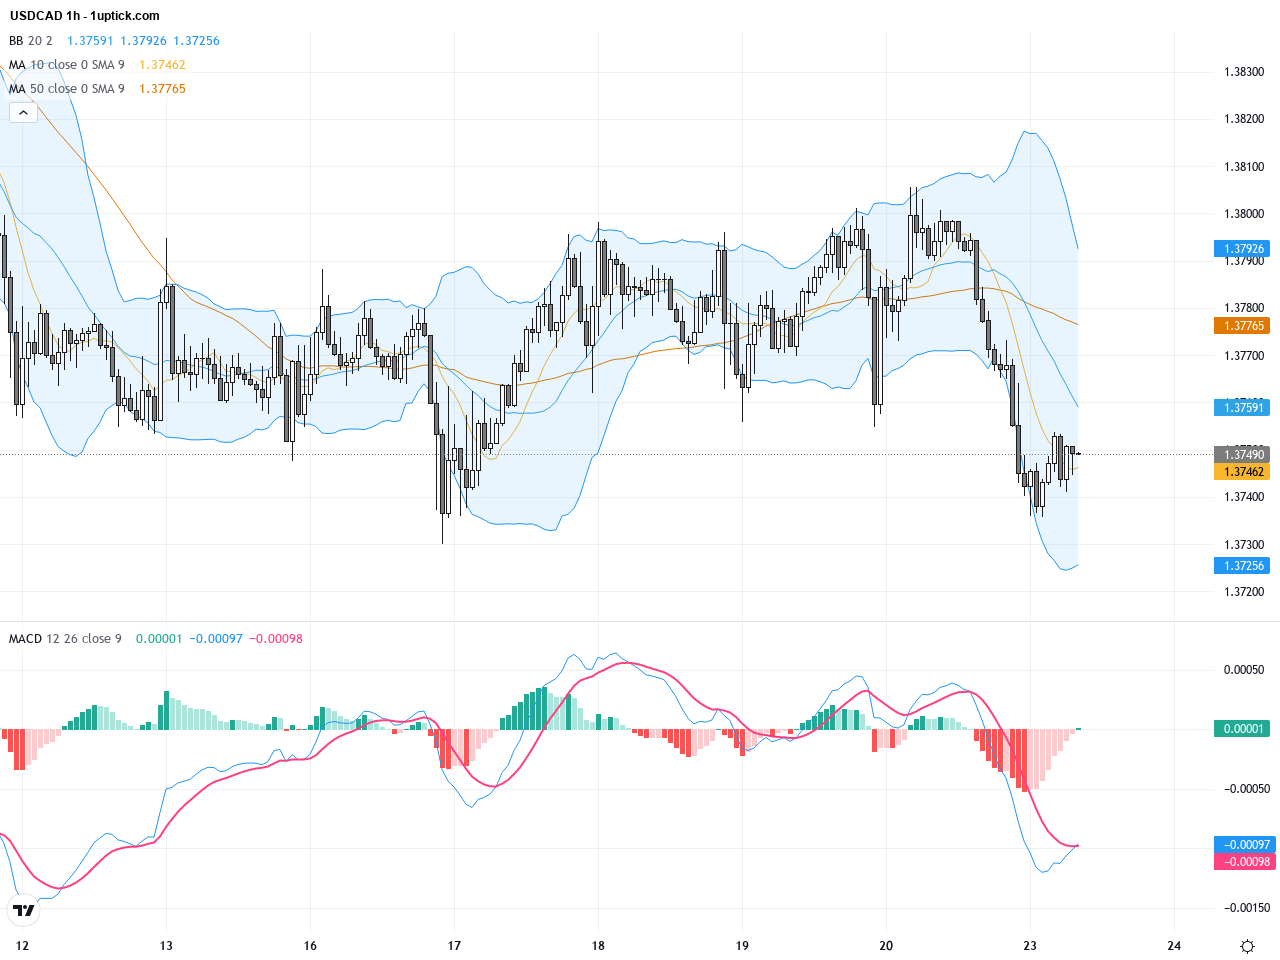
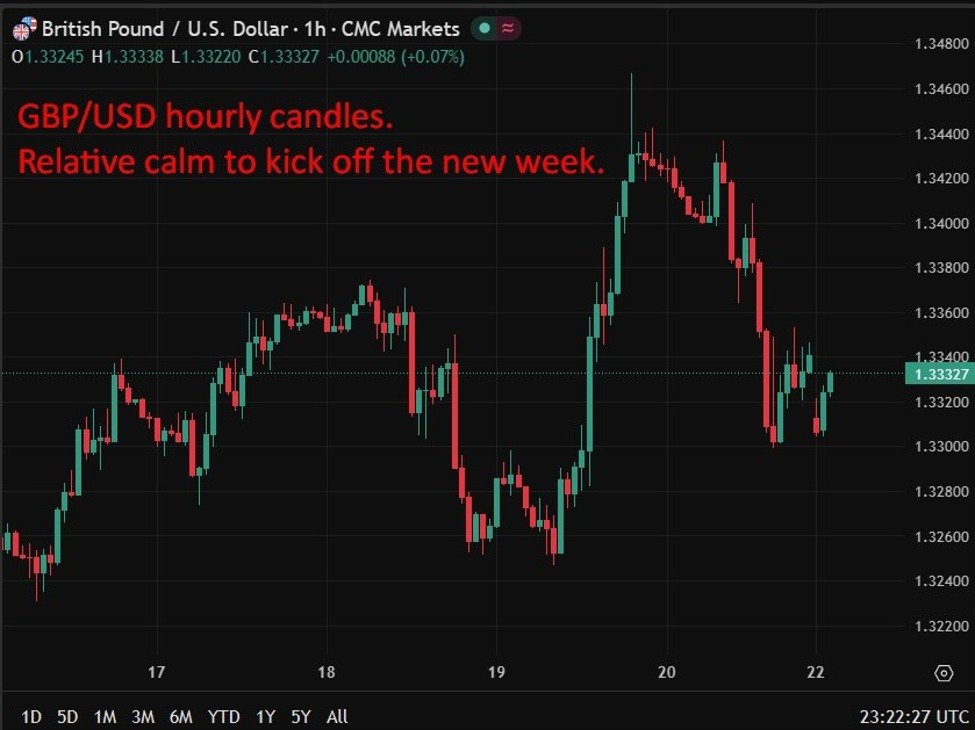
The hourly chart over the past five days shows a clear downtrend, with the price repeatedly testing but failing to break through support near 1.3740, forming a double bottom pattern. The Bollinger Bands indicate increased volatility with prices hovering near the lower band. Recent bullish MACD cross hints at a short-term rebound potential. The technical setup suggests strong short-term support, and a break above the recent hourly high near 1.38 could trigger upward momentum continuation.
Technical Trend: Currently showing a cautious consolidation phase with mixed short-term bottom signals and medium-term resistance, the trend direction remains uncertain and sideways.
Technically, USDCAD daily price action suggests consolidation with weakening momentum indicated by the MACD and intertwined short-term moving averages, alerting traders of potential selling pressure. The hourly chart hints at a short-term bottom with a double bottom and bullish MACD crossover, indicating rebound potential if price breaks above 1.38 resistance. Continued strength in oil prices supports the Canadian dollar and may exert downward pressure on the pair. Traders should watch for key technical breakouts alongside today’s critical economic data to identify high-probability trade setups.Today’s GMT+1 economic calendar highlights the Canadian October monthly GDP release at 14:30, expected at -0.2% versus a previous 0.2%. Simultaneously, the US will release its 3Q preliminary GDP and inflation indicators, with expectations of slowing US growth yet rising price levels. These releases will directly affect USD dynamics and thus USDCAD price fluctuations. Other regional data are less significant for USDCAD today. Market volatility is expected to concentrate around these North American data points later in the day.
Resistance & Support

The above financial market data, quotes, charts, statistics, exchange rates, news, research, analysis, buy or sell ratings, financial education, and other information are for reference only. Before making any trades based on this information, you should consult independent professional advice to verify pricing data or obtain more detailed market information. 1uptick.com should not be regarded as soliciting any subscriber or visitor to execute any trade. You are solely responsible for all of your own trading decisions.