


 |
| Gold V.1.3.1 signal Telegram Channel (English) |

USDJPY: Double Top Formation Signals Cautious Trading Outlook
2025-12-29 @ 08:01
Over the past 24 to 48 hours, USDJPY has seen increased volatility, closing yesterday at 156.47, an uptick from the previous 155.81. The main driver behind this movement is the Bank of Japan’s (BOJ) recent policy actions and softer-than-expected inflation data from Japan. On December 19, the BOJ raised its benchmark interest rate to 0.75%, a 30-year high, sparking expectations of a stronger yen, which led to a pullback in the USD/JPY exchange rate.
Additionally, the BOJ is set to release its Summary of Opinions report on Sunday, which investors are closely watching for clues on future monetary policy. Japan’s Finance Minister Satsuki Katayama issued a warning to markets to avoid one-sided and sharp currency moves, supporting the yen’s rally and reinforcing its recent strength.
Meanwhile, the US dollar remains under pressure amid weak fundamentals, with the dollar index dropping about 0.6% over the past week, adding further downside risk to USDJPY. In summary, the yen’s strength driven by the BOJ’s hawkish stance and rate hike combined with the dollar’s weakness has triggered a notable correction in USDJPY. Investors are advised to exercise caution amidst heightened volatility and avoid impulsive or revenge trading during this turbulent period.

The daily chart shows USDJPY starting from the 154 level and trending upwards over several weeks, recently approaching the 158 resistance level where a clear double top pattern has formed. The moving averages are bullish with the 50-day moving average above the 200-day, but price action faces rejection at this resistance, signaling weakening bullish momentum. The upper Bollinger Band is under pressure, and MACD divergence hints at a potential reversal. Overall, the trend remains bullish but caution is warranted for a possible short-term correction.
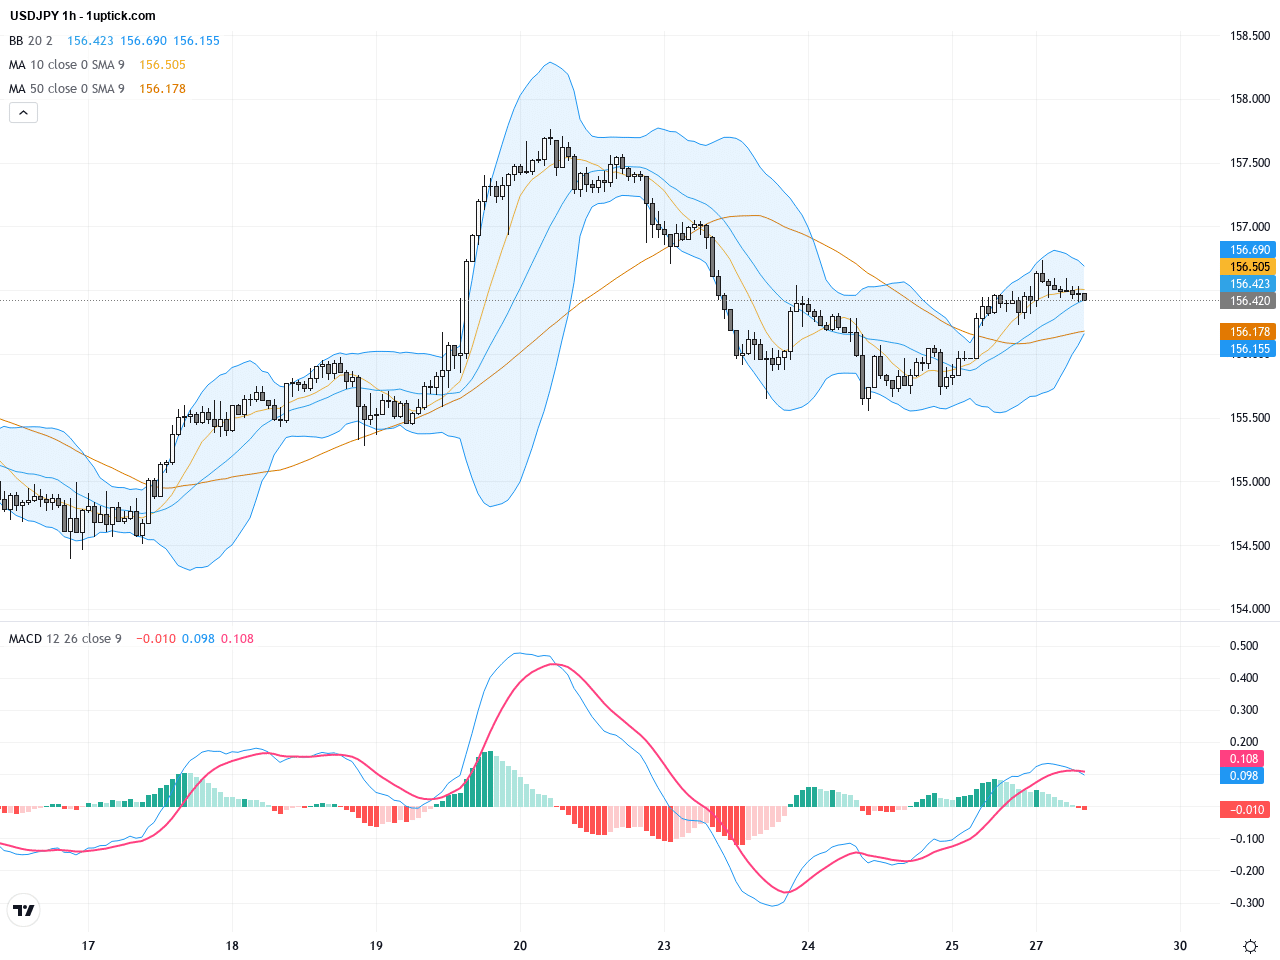
The hourly chart over the last 3-5 days reveals increased volatility in USDJPY trading between 156 and 157.5 levels. Short-term moving averages have crossed multiple times, reflecting a tug-of-war between bulls and bears. The weakening MACD histogram and narrowing Bollinger Bands suggest decreasing momentum and possible consolidation. A recent bearish engulfing candlestick signals potential downward movement, making it essential to watch today’s economic releases carefully.
Technical Trend: The current market trend is cautiously shifting into a consolidative phase with bearish undertones.
From a technical standpoint, the formation of a double top pattern marks strong resistance pressure on USDJPY. Daily MACD divergence indicates weakening uptrend momentum. The hourly bearish engulfing and Bollinger Bands contraction point to a likely short-term correction, presenting a high-probability trading opportunity. Investors should adhere strictly to their trading plans, avoid impulsive revenge trading, and wait for confirmed breakouts or retracements.Today’s economic calendar highlights key US data releases at 16:00 and 16:30 GMT+1, including Pending Home Sales and the Dallas Fed Manufacturing Index. While these have some market relevance, moderate forecasts mean their direct impact on USDJPY is expected to be limited. No significant Japan-related events are scheduled, so focus will remain on BOJ reports and global risk sentiment.
Resistance & Support

The above financial market data, quotes, charts, statistics, exchange rates, news, research, analysis, buy or sell ratings, financial education, and other information are for reference only. Before making any trades based on this information, you should consult independent professional advice to verify pricing data or obtain more detailed market information. 1uptick.com should not be regarded as soliciting any subscriber or visitor to execute any trade. You are solely responsible for all of your own trading decisions.