


 |
| Gold V.1.3.1 signal Telegram Channel (English) |

USDJPY: Key Technical Patterns Signal Heightened Short-term Pressure Amid BoJ Rate Hike Outlook
2025-12-15 @ 08:01
Over the past 24 to 48 hours, the USD/JPY pair has experienced slight downward volatility, moving from yesterday’s closing price of 155.866 to around 155.75. This movement was primarily driven by expectations of a Federal Reserve rate cut alongside the Bank of Japan’s upcoming rate hike, causing the US dollar to weaken as the Japanese yen strengthened.
Recent market news highlights the Bank of Japan’s plan to implement its first rate increase in 11 months, strengthening the yen and potentially triggering an unwind of yen carry trades, which adds to short-term market volatility. Meanwhile, the Federal Reserve’s signals of imminent rate cuts have pressured the dollar, leading to a decline in the USD/JPY rate. Overall, this price action reflects the significant policy divergence between two major central banks, with investors closely monitoring BoJ decisions for future currency direction.
For the average investor, this means staying alert to macroeconomic policy shifts that could impact the forex market, as dollar weakness and yen strength might require flexible investment approaches to manage risk effectively in this environment.
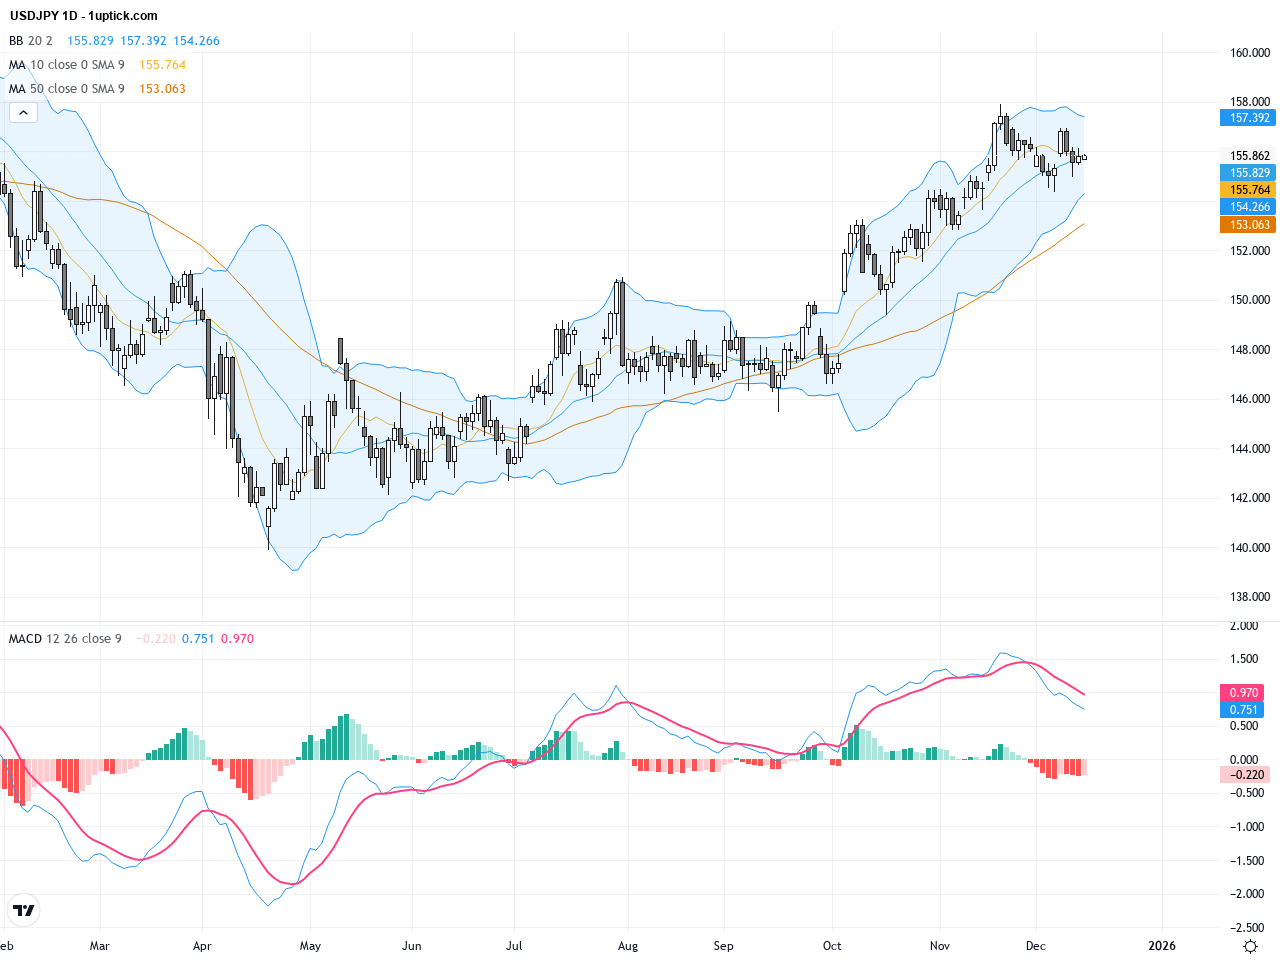
The daily chart reveals an overall uptrend for USDJPY since the beginning of the year, supported by steady bullish momentum. Prices have recently consolidated within the 155 to 157 range, forming a probable rectangular trading pattern indicating a battle between buyers and sellers. The 50-day moving average remains upward sloping with price bouncing off it multiple times, establishing clear support. However, the MACD shows a downward adjustment signal that suggests short-term pullback pressure despite a strong long-term trend.
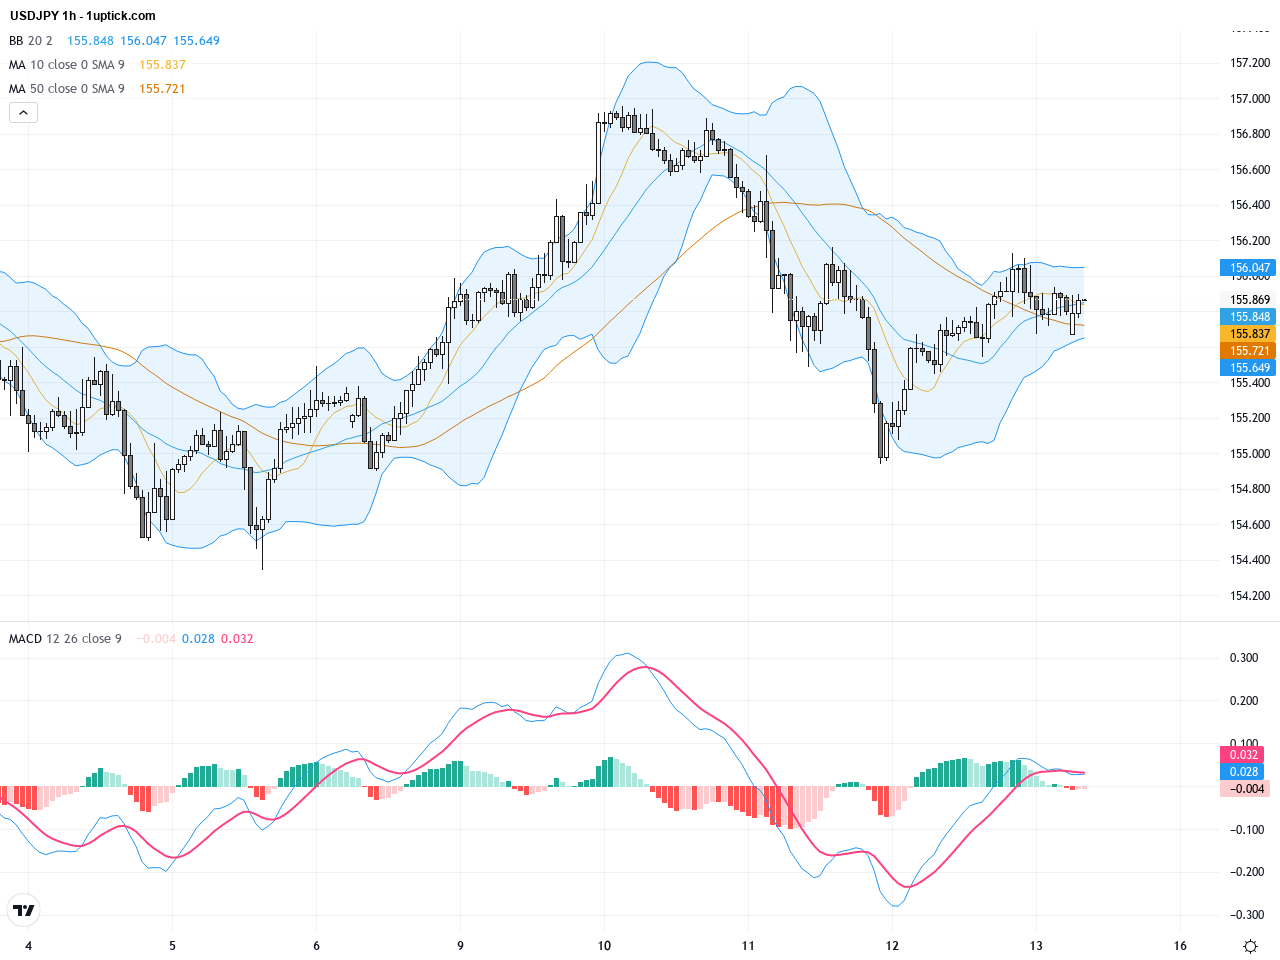
The hourly chart over the last 3 to 5 days illustrates increased volatility with prices repeatedly testing support and resistance amid news developments. Price action oscillates near the middle Bollinger Band, with several MACD bearish crossovers signaling intensifying selling pressure. A recent bearish engulfing candlestick further implies downward momentum may persist in the short run, urging traders to carefully manage risk with strategic stop losses.
Technical Trend: Short-term cautious bearish consolidation amid sustained long-term uptrend.
Technically, USDJPY maintains its longer-term bullish bias, yet short-term correction signals demand attention. The daily chart’s rectangular consolidation suggests the market is poised for a directional move, while the expanding negative MACD momentum highlights potential near-term downside. The hourly bearish engulfing pattern reinforces the likelihood of continued pullback momentum. Traders should monitor MACD crossovers and Bollinger Band expansions as key cues for timing entries and exits.Today’s economic calendar (GMT+1) features no significant or direct events expected to impact USDJPY trading. Market participants should remain attentive to forthcoming economic data releases and central bank meetings from the US and Japan for potential catalysts that could shift the current price dynamics.
Resistance & Support

The above financial market data, quotes, charts, statistics, exchange rates, news, research, analysis, buy or sell ratings, financial education, and other information are for reference only. Before making any trades based on this information, you should consult independent professional advice to verify pricing data or obtain more detailed market information. 1uptick.com should not be regarded as soliciting any subscriber or visitor to execute any trade. You are solely responsible for all of your own trading decisions.
Latest Technical Analysis
Latest Insightz