


 |
| Gold V.1.3.1 signal Telegram Channel (English) |

USDJPY Technical & Fundamental Analysis: Key Support and Resistance Amid Yen Intervention Threat
2025-12-24 @ 08:01
Over the past 24 to 48 hours, the USD/JPY pair saw notable volatility, closing yesterday at 156.157, down from the previous close of 157.003. The US dollar showed clear weakness as the market awaited key US economic data releases, while the Japanese yen strengthened amid rumors of potential intervention by the Bank of Japan (BOJ).
On December 19, the BOJ raised its benchmark interest rate to 0.75%, the highest in 30 years, signaling efforts to combat inflation. This policy shift increased the yen’s appeal, causing the USD/JPY rate to retreat from recent highs. Additionally, Japanese officials warned of possible forex market intervention to prevent excessive depreciation of the yen, which dampened confidence in the dollar and further supported yen strength.
For the average investor, it’s like a race where the leading runner (the dollar) suddenly tires, allowing the contender behind (the yen) to surge ahead. The uncertainty and changing policy signals have created a challenging environment for the USD/JPY rate, urging investors to closely monitor upcoming economic data and the BOJ’s policy moves.

The daily chart reveals an overall uptrend for USDJPY since the beginning of the year, but recent price action encountered resistance near 158.85 and retraced. The 50-day moving average (154.43) remains above the 200-day moving average (148.54), confirming medium to long-term bullish bias. Bollinger Bands have narrowed, indicating reduced volatility and potential consolidation. The MACD signals weakening momentum as multiple touches of the upper band suggest short-term selling pressure. The market currently appears to be in a corrective phase within the broader uptrend.
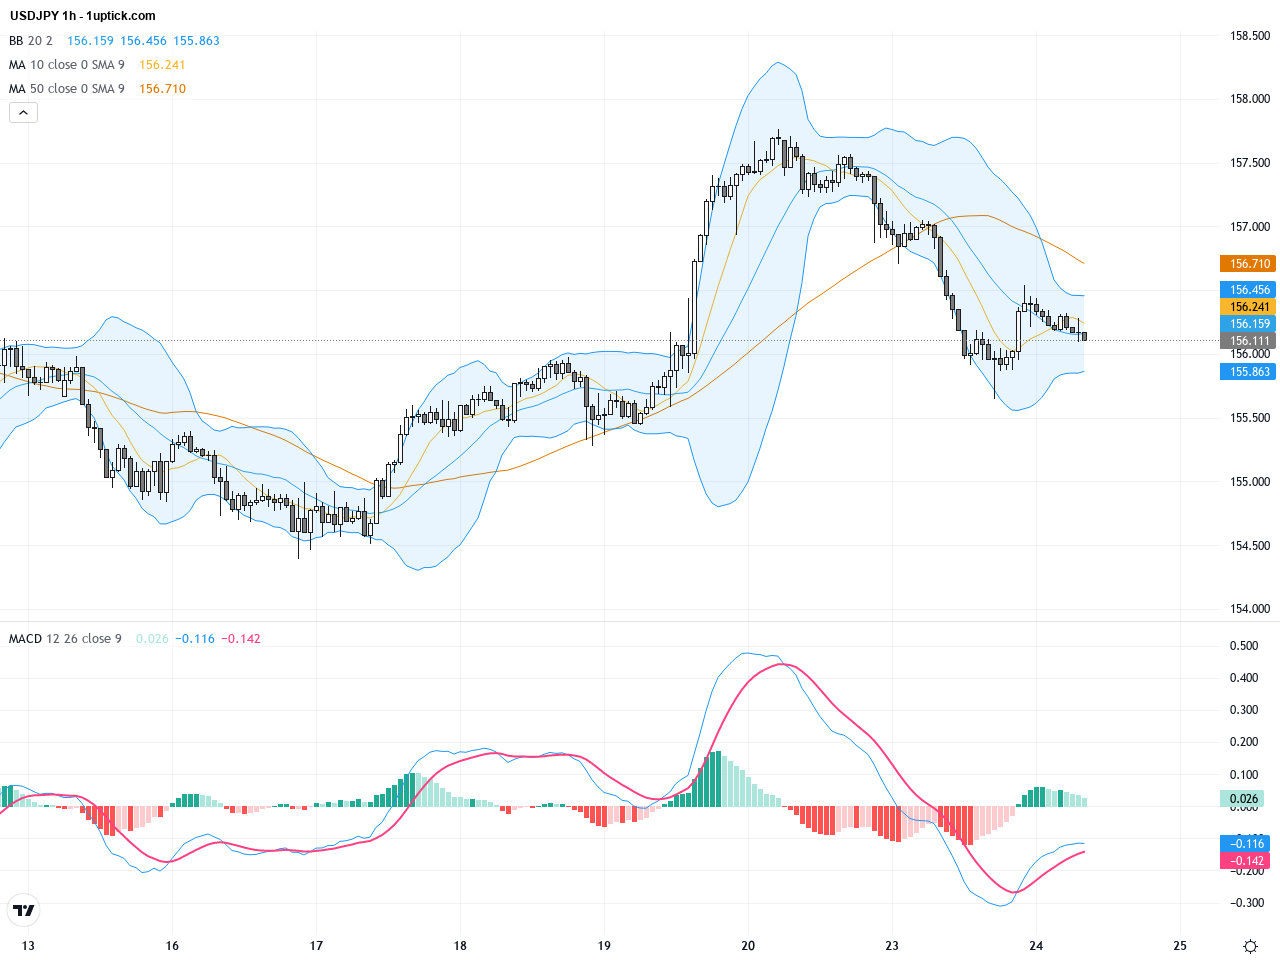
Examining the hourly chart over the past 3-5 days, USDJPY has struggled around the 156.5 resistance level with short-term moving averages intersecting, forming a sideways oscillation. The MACD is near a bearish crossover, implying possible short-term downward momentum. Recent candlesticks include doji and small bearish candles, reflecting heightened market indecision and cautious sentiment. Bollinger Bands flatten around the middle band, indicating price trading near a critical pivot zone between support and resistance, suggesting ongoing consolidation.
Technical Trend: The current trend direction is cautiously sideways, marked by short-term consolidation and mixed sentiment.
The key technical insights show that the daily chart maintains a bullish configuration with the 50-day moving average above the 200-day, but momentum is fading as evidenced by the narrowing Bollinger Bands and weakening MACD. The hourly chart’s MACD nearing a bearish crossover signals shorter-term downside risk. Recent candlestick patterns such as doji and small bearish candles denote market hesitation. Key support at 156.00 and resistance near 157.00 to 158.50 define the immediate battle zones. Traders should monitor these levels along with technical indicators and policy developments to identify potential high-probability trade setups.Today’s economic calendar in GMT+1 includes several key US releases directly affecting USDJPY, notably the Q3 Annualized GDP Prelim, PCE Core, and Durable Goods Orders at 14:30 GMT+1. Positive surprises in these data points could bolster the US dollar and support USDJPY upside, while disappointing figures may exert downward pressure on the pair. Other releases from Australia and Europe are less relevant to USDJPY’s immediate price action. The market will closely watch these US statistics to gauge the dollar’s strength amid central bank uncertainty.
Resistance & Support

The above financial market data, quotes, charts, statistics, exchange rates, news, research, analysis, buy or sell ratings, financial education, and other information are for reference only. Before making any trades based on this information, you should consult independent professional advice to verify pricing data or obtain more detailed market information. 1uptick.com should not be regarded as soliciting any subscriber or visitor to execute any trade. You are solely responsible for all of your own trading decisions.