


 |
| Gold V.1.3.1 signal Telegram Channel (English) |
USDJPY: Technical Patterns Signal Yen Strength – Key Support and Resistance Levels to Watch
2025-12-12 @ 08:01
Over the past 24 to 48 hours, the USD/JPY pair has experienced notable volatility. The U.S. dollar extended its losses following the Federal Reserve’s rate cut and liquidity-boosting measures, pushing the dollar index (DXY) to a 1.75-month low and applying broad pressure on the greenback. USD/JPY fell from yesterday’s close near 155.48 to a low of around 154.94, marking a decline of approximately 0.3%.
Weak U.S. jobs data further undermined the dollar’s momentum, attracting selling interest in the Asian session around the 155.50 to 155.60 level. Meanwhile, the Bank of Japan continues its accommodative stance, creating a policy divergence with the Fed, which in turn strengthened the yen against the dollar, increasing downward pressure on USD/JPY.
For the average investor, this scenario can be viewed as the dollar weakening due to Fed rate cuts and concerns over the U.S. economic slowdown, losing its dominance over the yen. The yen’s relative strength implies potential currency risks for dollar-based holdings. Overall, the recent market news has directly driven USD/JPY lower, reflecting the fundamental impact of the Fed-BoJ policy gap and economic data.

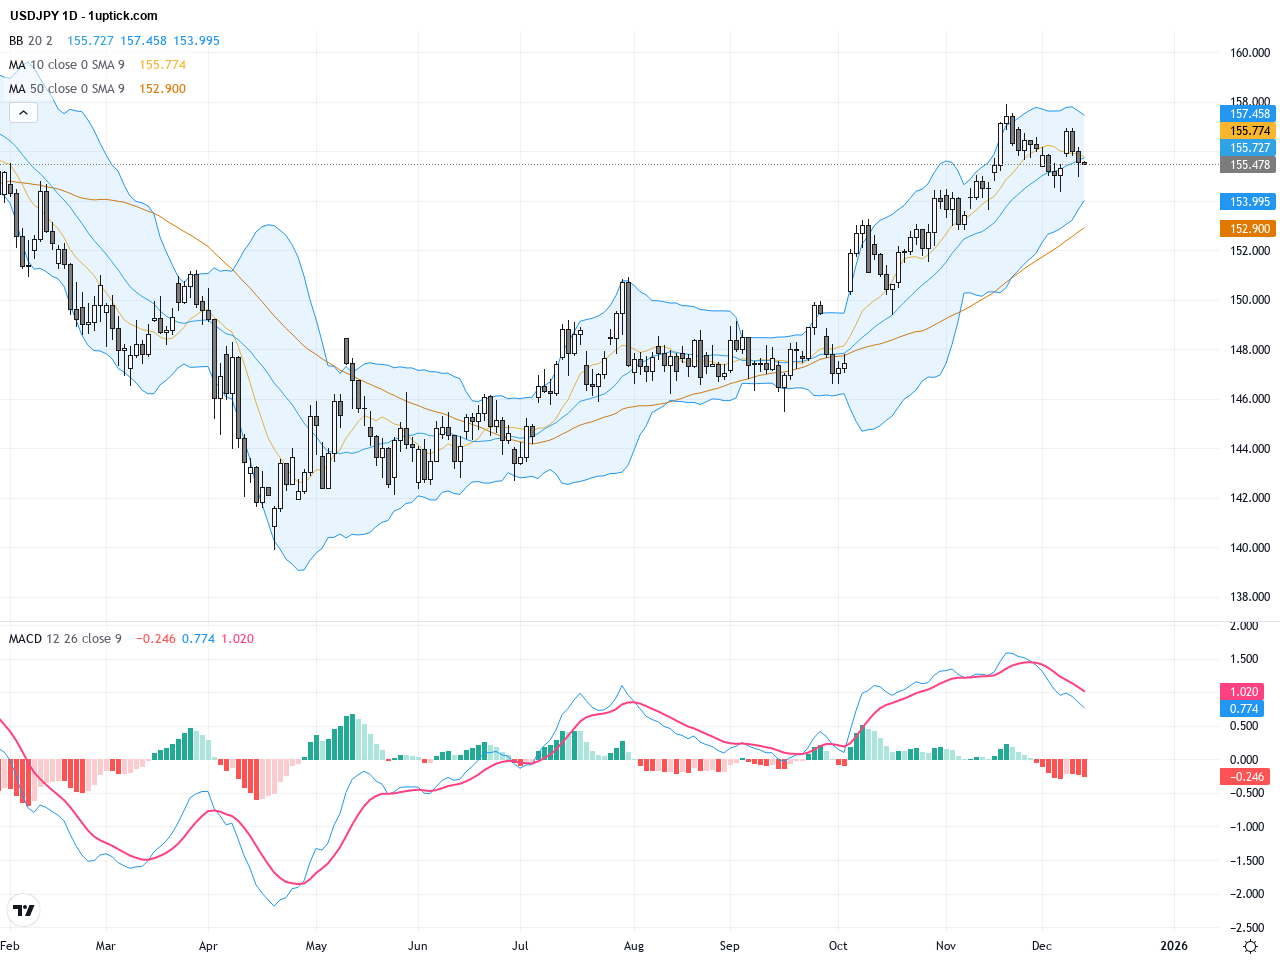
The daily chart shows USDJPY in a corrective phase from the year-to-date high near 158.85, with prices remaining above the 50-day (153.59) and 200-day (148.25) moving averages, indicating an overall bullish long-term outlook. Since early December, price action has consolidated around 155, with Bollinger Bands contracting as RSI stabilizes. The MACD indicator is nearing a bearish crossover, signaling potential weakening momentum but no confirmed reversal yet. Overall, the daily timeframe signals a pause in the uptrend and advises watching key levels for further direction.
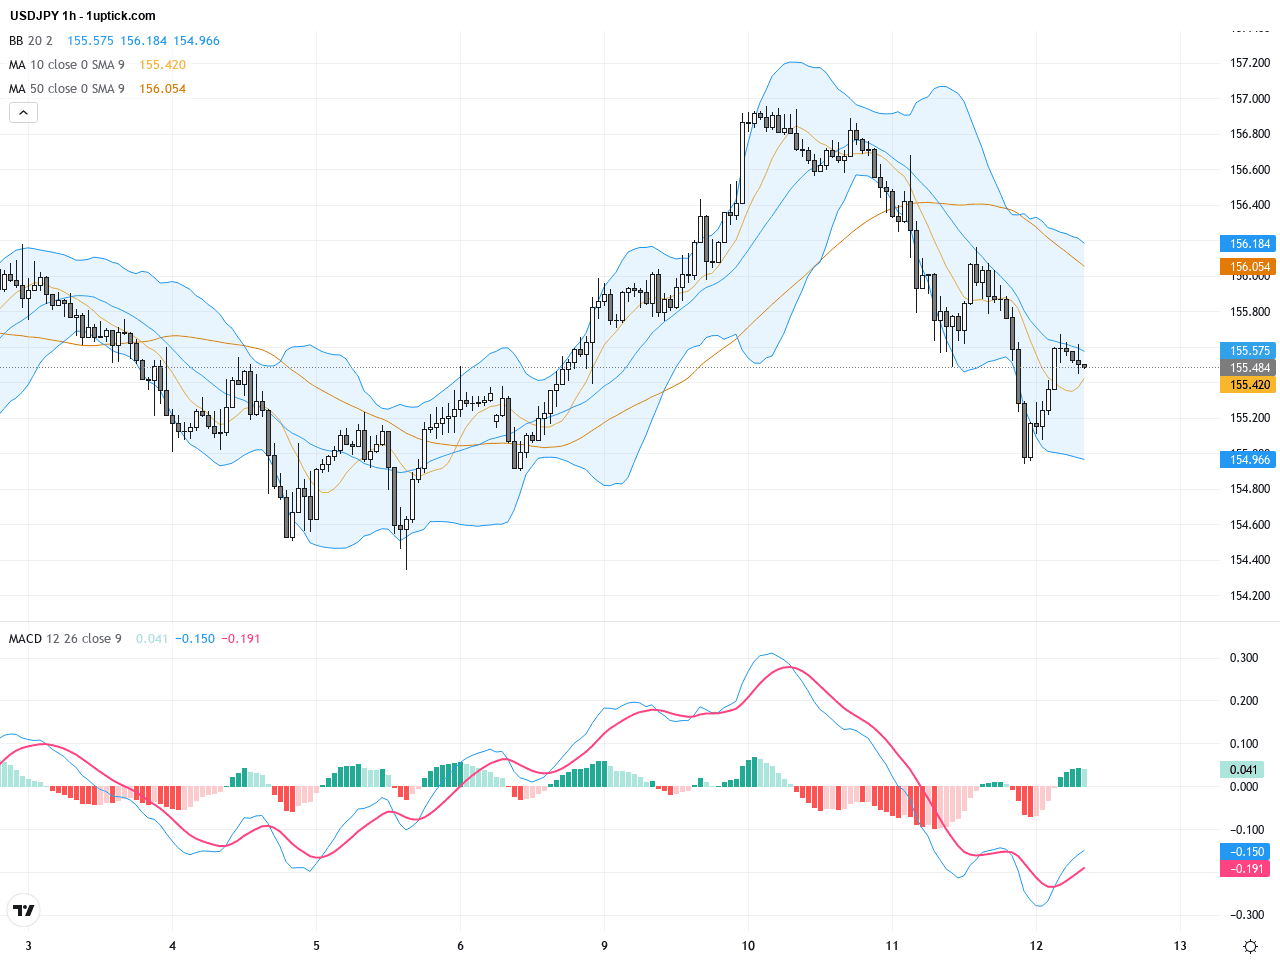
The hourly chart over the last 3-5 days reveals a short-term downtrend channel, with prices declining from about 156.5 to lows near 154.9. Short-term moving averages have crossed bearish and MACD momentum has increased on sell volume. The Bollinger Bands are narrowing, suggesting consolidation ahead, but recent hammer and engulfing candlestick patterns hint at possible near-term rebounds. This mixed technical picture requires close monitoring for a potential turn or continuation of the downward momentum.
Technical Trend: Cautiously bearish with ongoing consolidation and increasing yen strength amid subdued volatility.
Technically, USDJPY is forming a descending triangle pattern on the daily chart beginning early December. A decisive break below the 155.0 support could accelerate downside momentum. On the hourly chart, the MACD bearish crossover and weakening short-term moving averages confirm seller dominance; however, recent hammer candles suggest short-term rebounds cannot be ruled out. Key attention should be on price action near 155 support to gauge future trend direction.Today’s economic calendar features Japan’s October Industrial Production release at 05:30 GMT+1, forecasted at 1.4% m/m down from 2.6%. This data is significant for USDJPY as stronger industrial output could boost the yen, while weaker results may weigh on it. No other major events directly impacting USDJPY are scheduled today. Traders should also note the time zone difference (GMT+1 vs HK time) when planning trades around data releases and market sessions.
Resistance & Support

The above financial market data, quotes, charts, statistics, exchange rates, news, research, analysis, buy or sell ratings, financial education, and other information are for reference only. Before making any trades based on this information, you should consult independent professional advice to verify pricing data or obtain more detailed market information. 1uptick.com should not be regarded as soliciting any subscriber or visitor to execute any trade. You are solely responsible for all of your own trading decisions.
Latest Technical Analysis
Latest Insightz