


 |
| Gold V.1.3.1 signal Telegram Channel (English) |

WTI Crude Oil: Geopolitical Tensions Fuel Price Rebound Amid Technical Uptrend
2025-12-23 @ 08:01
Over the past 24 to 48 hours, the WTI crude oil market has experienced notable volatility, with yesterday’s closing price at $57.86, reflecting a steady upward trend. Recent intensified U.S. sanctions on Venezuelan oil shipments have captured market attention. The U.S. Coast Guard’s seizure of a supertanker carrying Venezuelan oil and attempts to intercept two more vessels have significantly slowed Venezuela’s oil loading activities, causing some tankers to make U-turns.
This development has sparked concerns among investors about potential supply disruptions, driving oil prices higher. Additionally, continued strikes by Ukraine on Russia’s oil infrastructure add further uncertainty, with these combined geopolitical risks supporting oil prices above $57. This situation illustrates to everyday investors how geopolitical events can rapidly disrupt oil supply chains and influence market price movements and investment strategies.

The daily chart reveals a gradual uptrend in WTI Crude Oil prices, rising from a low near $55 in late November to hovering around $57-58 recently. Bollinger Bands have tightened, signaling reduced volatility, while the MACD suggests increasing bullish momentum. A golden cross formed by the 20-day and 50-day moving averages strengthens the medium-term bullish case, though resistance near $58.5 remains a critical hurdle for continuation.
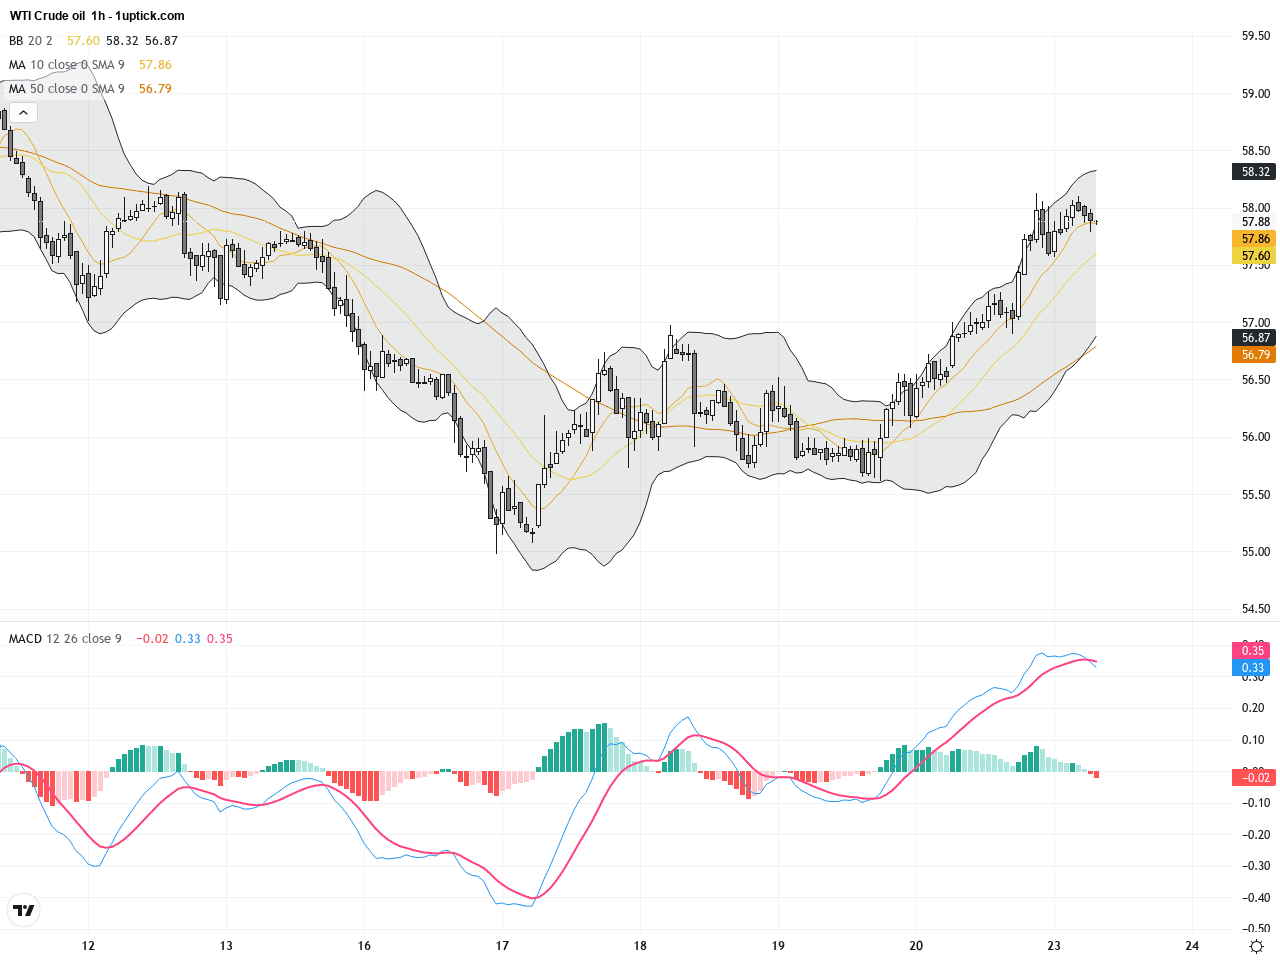
The hourly chart over the past 3-5 days shows WTI price oscillating between $56 and $58 with frequent volatility. Bollinger Bands have recently widened and the MACD has crossed above zero, indicating strengthening short-term bullish momentum. The RSI stays near 60, leaving room before entering overbought territory. An ascending triangle pattern is forming with a key resistance neckline at $58.2; a breakout above this point could trigger a strong upward move.
Technical Trend: WTI Crude Oil currently exhibits a cautiously bullish consolidation pattern, with short-to-medium-term price action skewed towards a moderate uptrend, pending confirmation of resistance breakout accompanied by volume.
Technically, WTI Crude Oil is approaching a critical resistance at $58.5 with a battle between bulls and bears intensifying. The daily golden cross combined with bullish MACD momentum offers a bullish outlook. On the hourly scale, a breakout from the ascending triangle will likely accelerate gains. Traders can leverage these technical signals alongside current market news to identify high-probability trading opportunities.There are no major economic events scheduled today that directly affect WTI Crude Oil. Market attention remains focused on geopolitical risks and US actions against Venezuelan tankers. Traders should watch for upcoming US energy data releases and OPEC meetings later this week, which may cause increased price volatility.
Resistance & Support

The above financial market data, quotes, charts, statistics, exchange rates, news, research, analysis, buy or sell ratings, financial education, and other information are for reference only. Before making any trades based on this information, you should consult independent professional advice to verify pricing data or obtain more detailed market information. 1uptick.com should not be regarded as soliciting any subscriber or visitor to execute any trade. You are solely responsible for all of your own trading decisions.