


 |
| Gold V.1.3.1 signal Telegram Channel (English) |

WTI Crude Oil Technical & Fundamental Analysis: Supply Glut Concerns Test Key Support Levels
2025-12-16 @ 08:01
Over the past 24 to 48 hours, WTI crude oil prices have seen a notable decline, closing yesterday at $56.50 compared to $57.42 the day before. The market was primarily influenced by concerns over energy demand, particularly signs of slowing demand in China and other major economies. This dampened energy demand disrupted the supply-demand balance, pushing prices down to a two-month low.
Additionally, signs of oversupply in the US market further pressured prices. Although geopolitical tensions, such as rising strains between the US and Venezuela, provided temporary support, the overall narrative was dominated by excess supply and weak demand. Trading volumes were thin, with volatility subdued ahead of the Christmas and New Year holidays.
For everyday investors, this price drop reflects risks around slowing global economic growth and worries about future energy demand. Simply put, it’s like demand for fuel at home suddenly dropping, causing inventory to build up and prices to fall. Whether prices rebound will depend on clear demand recovery or supply adjustments ahead.
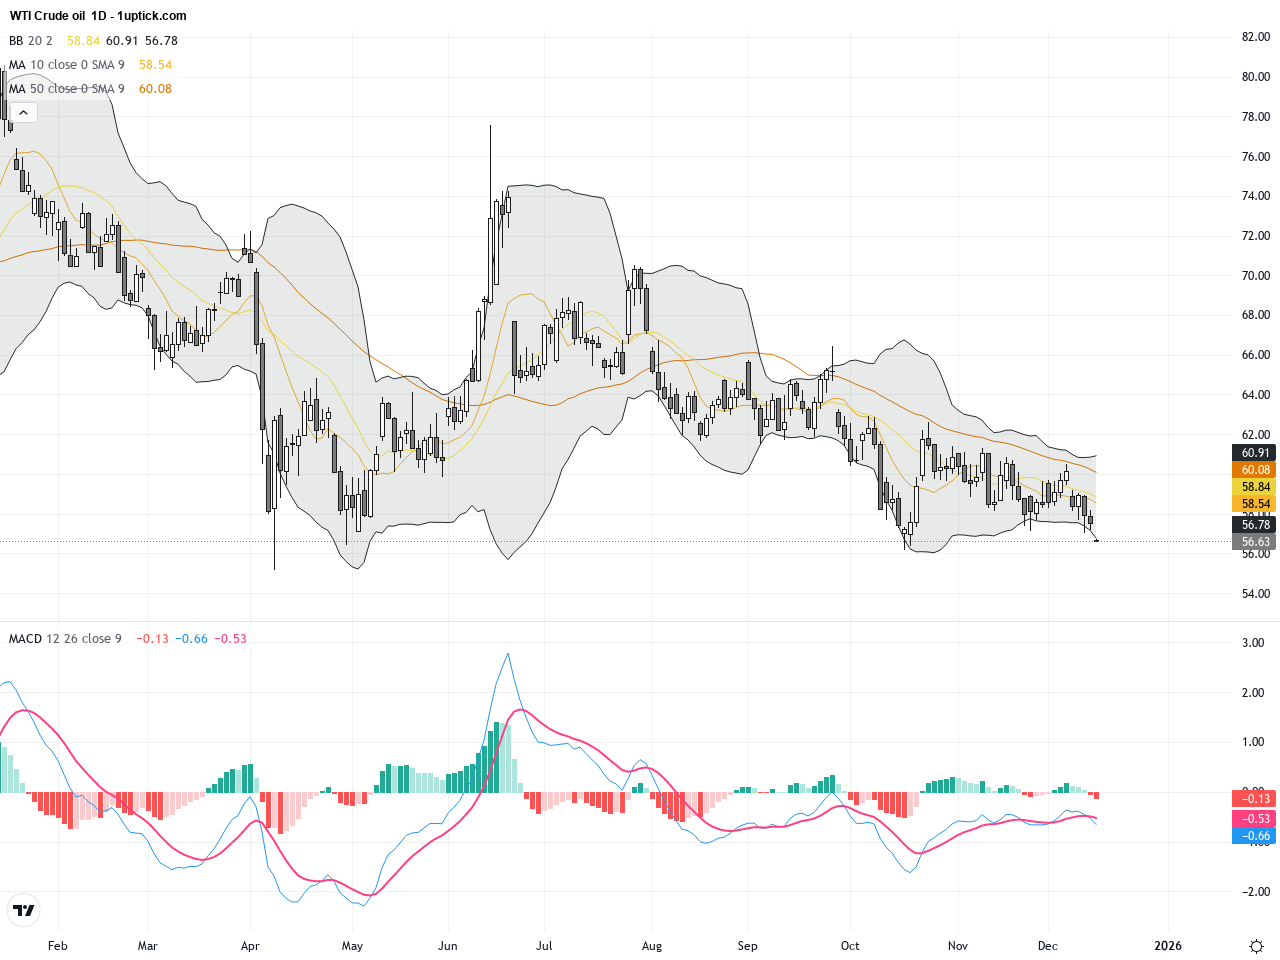
The daily chart shows a clear downtrend since mid-November, with WTI crude repeatedly failing to sustain rebounds around the $57 level. Recent daily candlesticks display bearish engulfing patterns, reflecting strong selling pressure. Short-term moving averages (10-day and 20-day) slope downward, and the MACD remains in negative territory with diminishing momentum bars, signaling bearish momentum. Bollinger Bands indicate price nearing the lower band, accompanied by increased volatility, which could suggest oversold conditions warranting close monitoring for reversal signals.
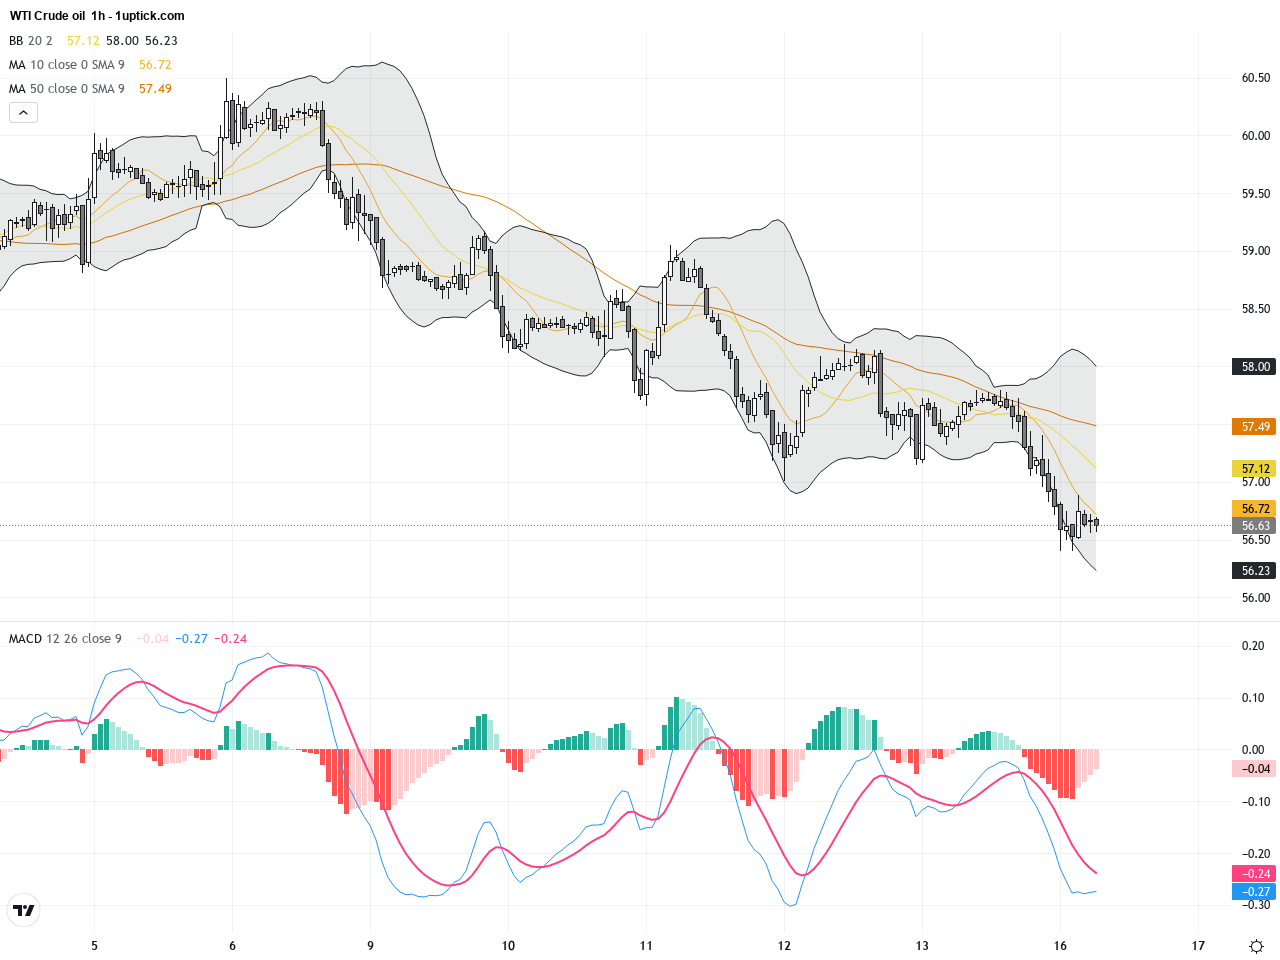
The hourly chart over the past 3-5 days illustrates a choppy downtrend, with prices breaking short-term supports and forming a descending wedge or minor flag consolidation pattern. The MACD exhibits a bearish crossover below zero, while the RSI approaches 30, confirming sustained selling pressure. Notably, a recent hammer candlestick suggests potential buying interest at lower levels, offering a possible short-term rebound. However, the overall momentum favors further downside until confirmed otherwise.
Technical Trend: WTI crude oil exhibits a cautiously bearish trend with volatile downward price action in the short to medium term.
Technical indicators signal that WTI is testing crucial support zones, with a MACD bearish crossover and low RSI reinforcing downward momentum. While the daily Bollinger Band lower bound and a recent hammer candlestick pattern suggest a short-term pause or bounce, failure to hold the $56 support could precipitate deeper declines. Given fundamental concerns over oversupply and sluggish demand, traders should adopt cautious approaches, monitoring price and volume changes closely to identify high-probability trading opportunities.No significant economic events are scheduled today that would have a direct impact on WTI crude oil prices. Traders should remain alert for upcoming U.S. inventory reports and energy demand indicators from key global economies later this week, which may trigger notable price volatility. The timing of these data releases in HKT aligns with late evening sessions in the United States, potentially influencing short-term price action.
Resistance & Support

The above financial market data, quotes, charts, statistics, exchange rates, news, research, analysis, buy or sell ratings, financial education, and other information are for reference only. Before making any trades based on this information, you should consult independent professional advice to verify pricing data or obtain more detailed market information. 1uptick.com should not be regarded as soliciting any subscriber or visitor to execute any trade. You are solely responsible for all of your own trading decisions.