
 |
| Gold V.1.3.1 signal Telegram Channel (English) |
XAUUSD: Gold Surges Past $4200 Resistance on Fed Rate Cut, Key Levels to Watch
2025-12-11 @ 16:21
Over the past 24 to 48 hours, gold prices (XAUUSD) showcased notable volatility, climbing steadily to around $4,235, a marked rise from the December 11 closing price of $4,213.95. This movement was primarily driven by the Federal Reserve’s expected interest rate cut, which bolstered bullish sentiment in gold and pushed prices higher.
The rate cut directly positioned gold as a preferred safe-haven asset, given that lower rates typically weaken the US dollar and increase demand for dollar-priced gold. Moreover, ongoing uncertainties around economic growth and inflation risks have sustained gold’s appeal as an inflation hedge.
For the average investor, this scenario resembles a safe harbor asset becoming more attractive amid economic uncertainties and falling interest rates—offering a stable store of value during unpredictable times. Investors adjusted portfolios in response to Fed policy moves, resulting in inflows into gold and driving recent price gains.

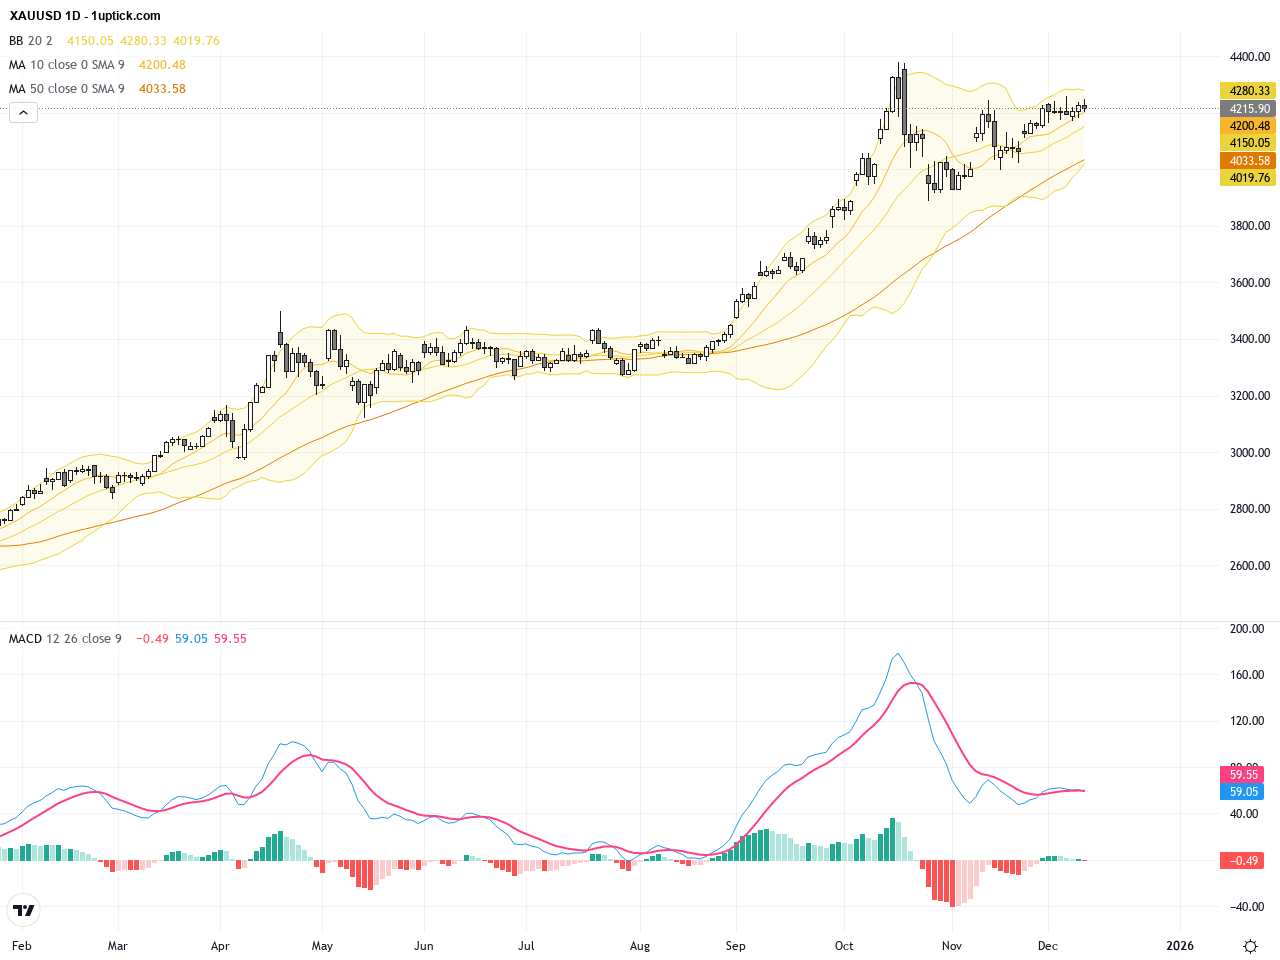
The XAUUSD daily chart illustrates a steady uptrend over recent weeks, with a clear breakout pattern forming. Prices have risen from around $4,110, repeatedly challenging and breaking through the critical $4,200 resistance level, signaling bullish dominance. The chart shows a golden cross between the 50-day and 200-day moving averages, reinforcing the upward trend. Bollinger Bands indicate price moves above the upper band, highlighting strong buying pressure. The MACD remains above zero with no bearish divergence, confirming sustained bullish momentum. Overall, daily technicals support continued strength in gold.

Zooming into the last 3-5 days on the XAUUSD hourly chart, price movements exhibit active fluctuations within an overall bullish bias. Short-term moving averages such as the 5-hour and 20-hour are in bullish alignment with price consistently closing above them. After a squeeze in the Bollinger Bands, price broke above the upper band suggesting potential upward continuation. MACD has formed a bullish crossover near the zero line while RSI remains above 60, indicating short-term bullish strength. Notably, recent hammer candlesticks with long lower shadows hint at solid support and possible near-term upside.
Technical Trend: XAUUSD is exhibiting a decisively bullish trend, with momentum indicators confirming sustained upward pressure and potential continuation of the breakout move.
Combining daily and hourly technical indicators, XAUUSD is currently in a strong bullish phase, particularly after breaking the pivotal $4,200 resistance. The golden cross and positive MACD on daily charts confirm the medium-term uptrend, while hammer candlesticks on hourly charts serve as near-term bullish signals. The Bollinger Bands breakout on hourly intervals suggests a potential for further price advances. Traders should focus on key support and resistance pivot points, alongside the upcoming U.S. economic data to capitalize on high-probability trading setups.Today’s GMT+1 economic calendar reveals no critical events directly impacting the USD or gold. However, the U.S. weekly jobless claims and trade balance data released at 14:30 GMT+1 could affect the USD’s short-term trajectory. If labor market figures disappoint, it may increase rate cut expectations, benefiting gold prices. Conversely, stronger-than-expected data might pressure gold. Other events, including China’s credit data and European Central Bank meetings, have limited immediate relevance to XAUUSD. Therefore, gold price action remains primarily influenced by USD performance and Fed rate expectations today.
Resistance & Support

The above financial market data, quotes, charts, statistics, exchange rates, news, research, analysis, buy or sell ratings, financial education, and other information are for reference only. Before making any trades based on this information, you should consult independent professional advice to verify pricing data or obtain more detailed market information. 1uptick.com should not be regarded as soliciting any subscriber or visitor to execute any trade. You are solely responsible for all of your own trading decisions.