


 |
| Gold V.1.3.1 signal Telegram Channel (English) |
XAUUSD Technical & Fundamental Analysis: Gold Breakout Faces Resistance, Short-Term Trading Outlook
2025-12-13 @ 18:52
Over the past 24 to 48 hours, gold (XAUUSD) has exhibited notable volatility and price movement worth attention. The closing price yesterday was $4,302.43. Recently, gold prices surged to a seven-week high before pausing near resistance levels. According to the latest market news, the Federal Reserve (Fed) delivered the expected rate cut along with dovish guidance, propelling gold prices to surge beyond $4,235 in early trading sessions. The rate cut expectations combined with a weaker US dollar were the primary catalysts behind gold’s rally.
However, the rally stalled as traders locked in profits near resistance, causing a temporary pause in upward momentum. This situation can be likened to a runner slowing down briefly just before crossing the finish line, despite underlying strength to push forward. Market watchers also noted US economic data hints at further potential rate cuts, which supports the bullish outlook for gold. For the average investor, this highlights gold’s growing appeal as a safe haven asset amid global economic uncertainties and low interest rate conditions, especially when the dollar is weak, providing additional support to precious metals.

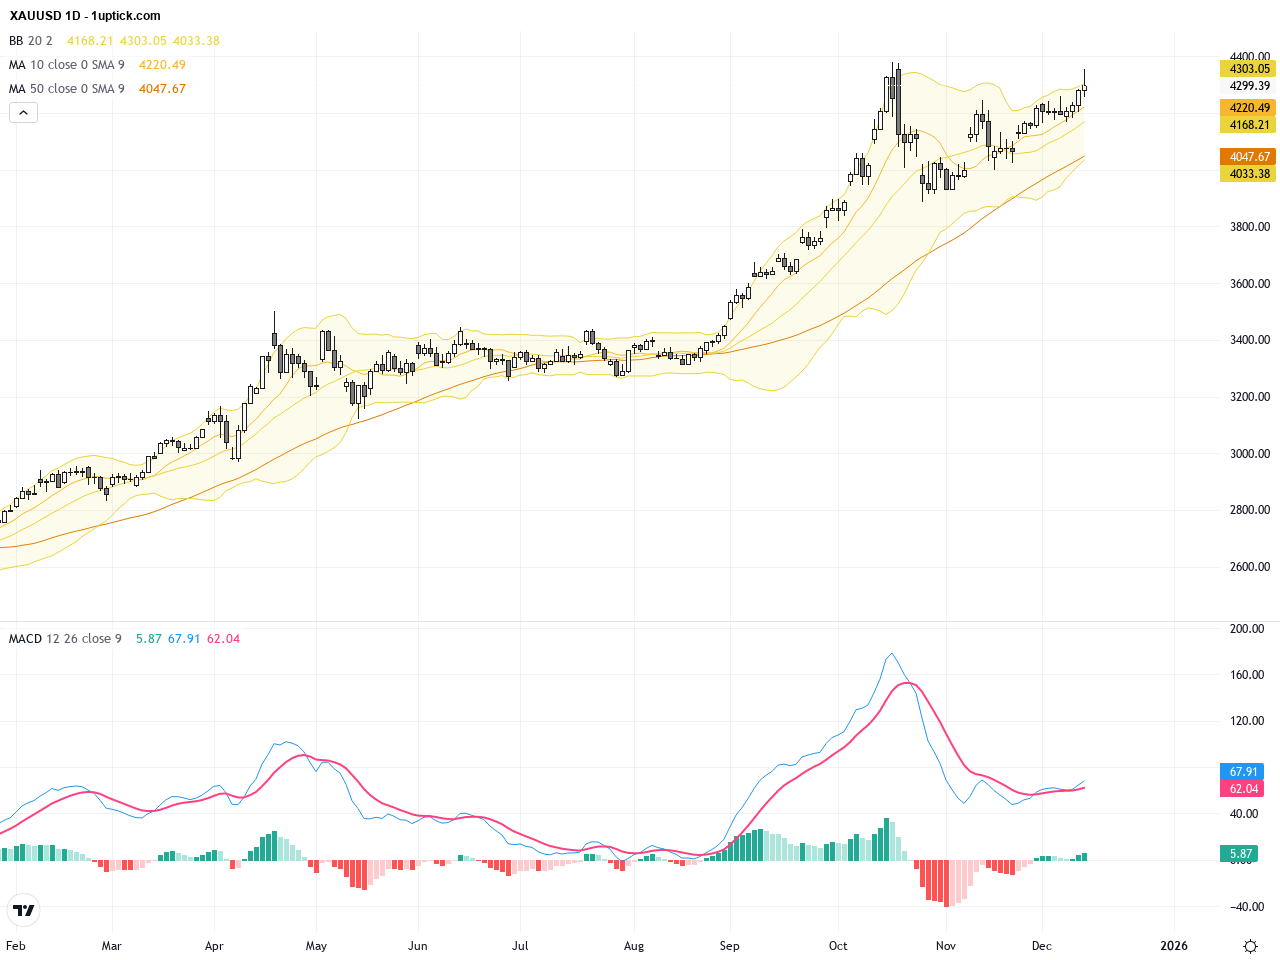
The daily chart shows a steady uptrend over recent weeks, with XAUUSD price moving from approximately $4150 to above $4300. Moving averages align bullishly, and Bollinger Bands upper band is frequently tested, signifying strong buying pressure. However, the MACD histogram indicates weakening momentum, suggesting a potential phase of consolidation. Overall, the medium-term outlook remains bullish, but short-term corrections are possible.
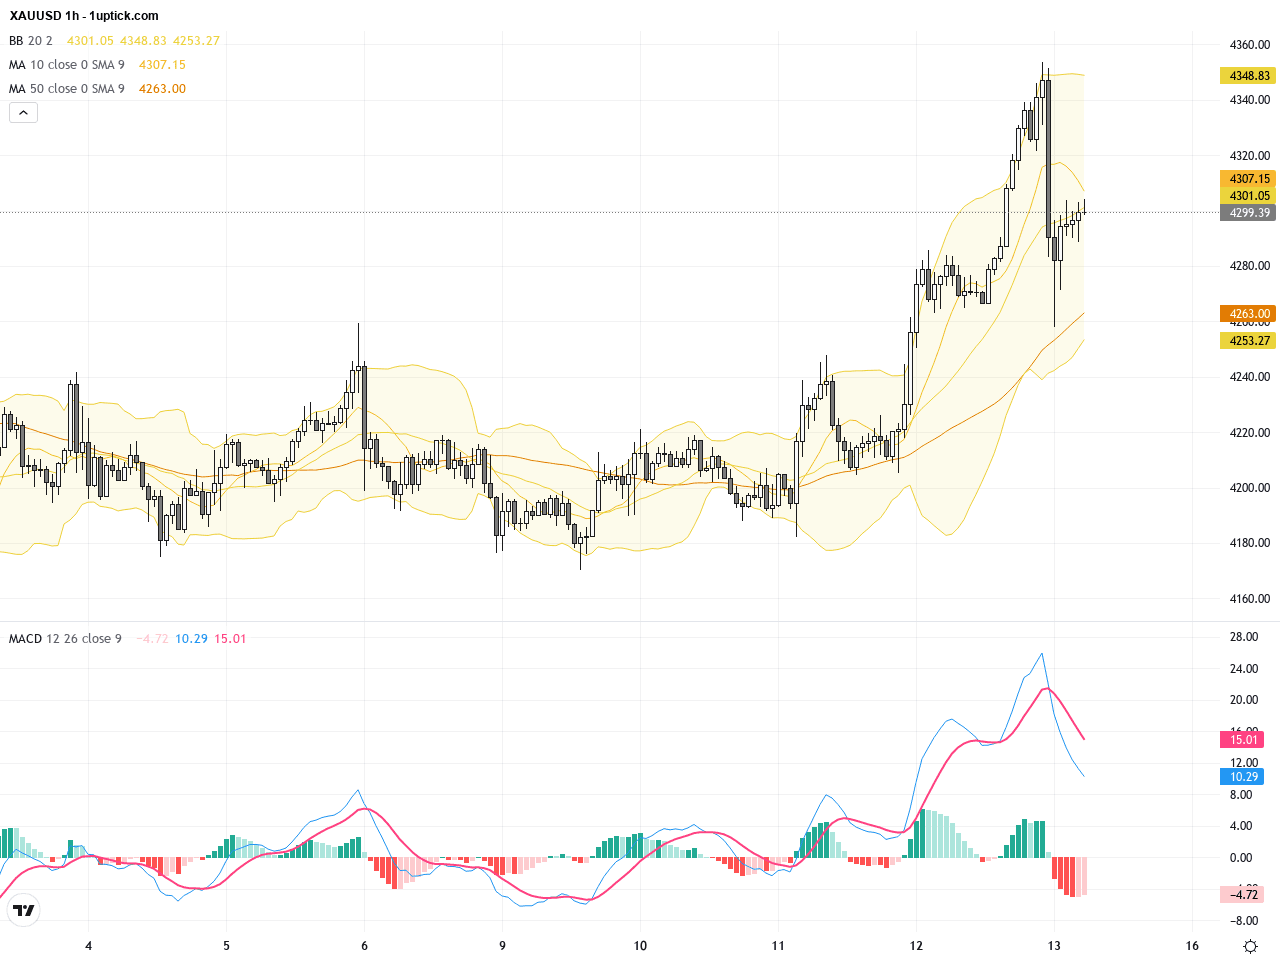
The hourly chart over the past 3-5 days displays a choppy upward trend. XAUUSD has repeatedly tested resistance near $4300 without a sustained breakout, forming multiple false breakouts. The 20 and 50-period moving averages converge, MACD shows bearish divergence, and Bollinger Bands have contracted after expansion, all indicating diminished short-term bullish momentum. This suggests a possible sideways movement or pullback to digest prior gains in the near term.
Technical Trend: XAUUSD currently shows a cautious bullish trend with increased short-term volatility, best described as ‘Cautiously Bullish’. Close attention is needed to confirm continuation or reversal at key resistance levels.
Key technical insights include a weakening MACD momentum on the daily chart indicating possible correction, and bearish divergence on the hourly MACD hinting at a potential short-term pullback. XAUUSD faces resistance around $4300; failure to break above this level may see price retreat toward $4250 support. Traders should look for clear breakout or pullback signals combined with volume confirmation for high-probability trades.Today’s GMT+1 economic calendar features no significant or direct events expected to impact XAUUSD. Traders should monitor upcoming US data releases and Fed communications closely as these remain key drivers affecting the USD and interest rates, and thus indirectly influence gold prices.
Resistance & Support

The above financial market data, quotes, charts, statistics, exchange rates, news, research, analysis, buy or sell ratings, financial education, and other information are for reference only. Before making any trades based on this information, you should consult independent professional advice to verify pricing data or obtain more detailed market information. 1uptick.com should not be regarded as soliciting any subscriber or visitor to execute any trade. You are solely responsible for all of your own trading decisions.