


 |
| Gold V.1.3.1 signal Telegram Channel (English) |
AUDUSD: Breakout from Multi-Month Range as Strong Aussie Jobs Data Fuels Bullish Momentum
2026-01-23 @ 06:01
Over the past 24 to 48 hours, the Australian Dollar against the US Dollar (AUD/USD) has demonstrated notable strength, closing near 0.6839—up significantly from the previous day’s 0.6761. This rally has been primarily driven by robust Australian employment data, which heightened market expectations for a rate hike from the Reserve Bank of Australia (RBA), thus boosting the currency’s appeal.
Moreover, the US dollar has been under pressure against various Asian currencies due to growing concerns around US policy credibility and ongoing geopolitical tensions, prompting investors to shift funds towards higher-yielding currencies like the AUD. Meanwhile, the Japanese yen has been relatively subdued as markets await the upcoming Bank of Japan (BoJ) policy meeting.
For the average investor, this means the Australian dollar’s fundamentals have strengthened thanks to better labor market conditions, allowing the currency to break out from a multi-month consolidation range. Consequently, traders and investors holding AUD might feel optimistic about near-term prospects, especially in a context of broad US dollar weakness.

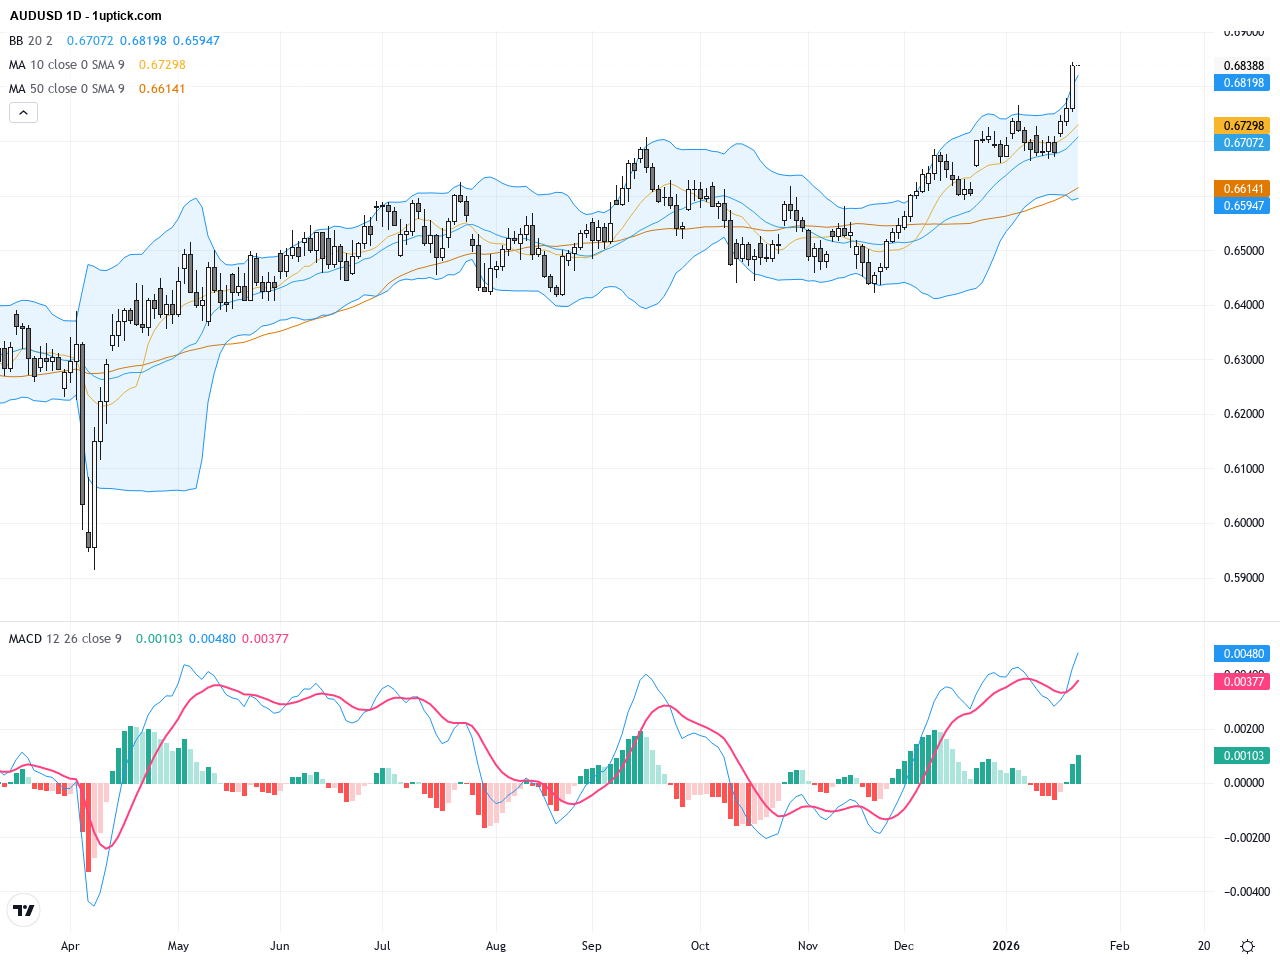
The daily chart shows a strong upward trend for AUDUSD since the start of the year, breaking above the significant 0.6800 psychological level yesterday. Both the 50-day and 200-day moving averages are in an uptrend with price clearly trading above them, confirming bullish momentum. Bollinger Bands are expanding, indicating increased volatility, and price is near the upper band suggesting a short-term pullback could occur. The MACD is positive and widening, supporting continued upside potential in the trend.
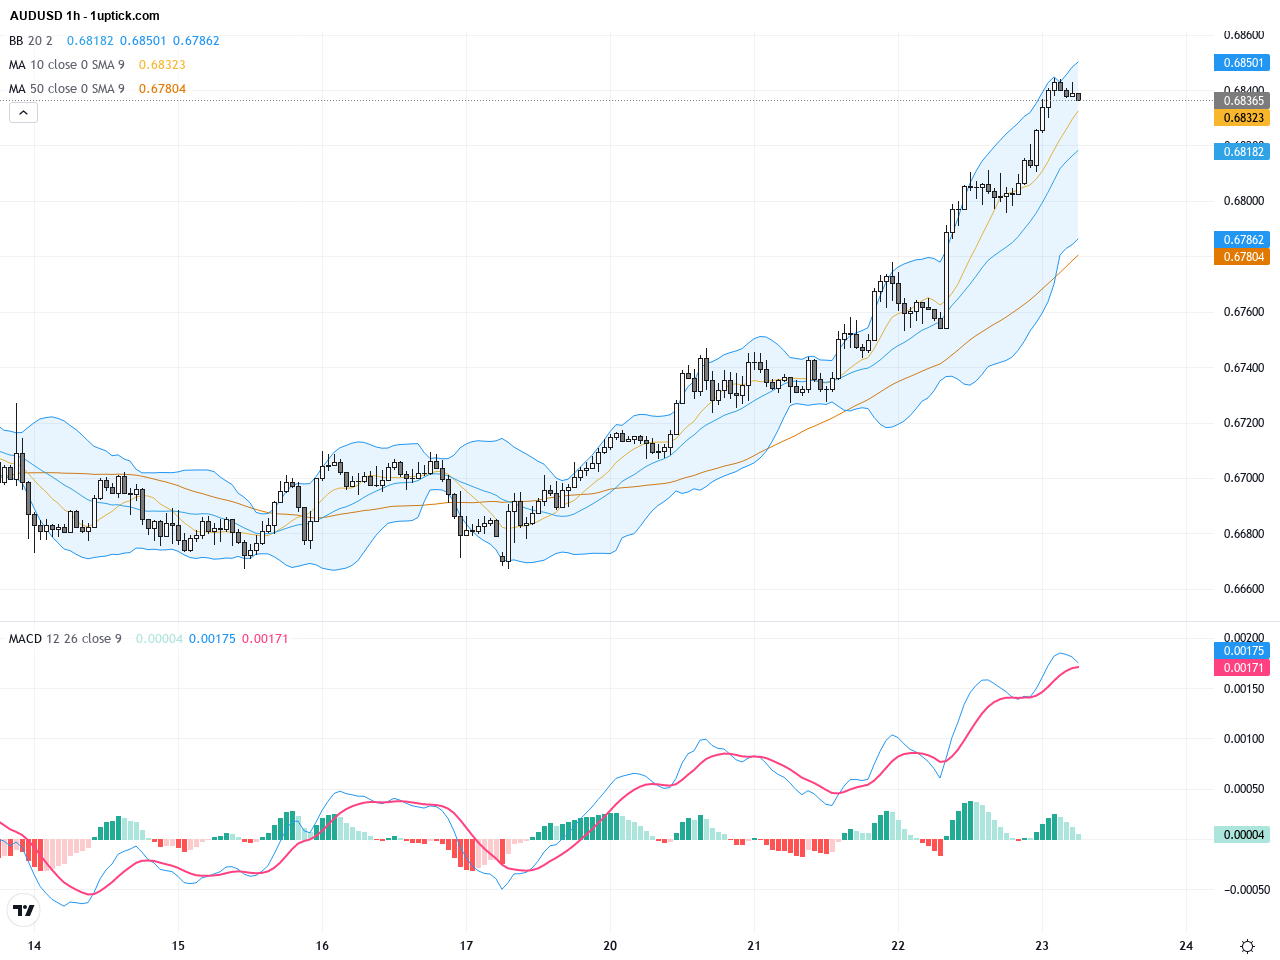
On the hourly chart over the past 3-5 days, AUDUSD has moved in a stair-step uptrend, breaking multiple resistance levels followed by brief consolidation. The 20- and 50-period moving averages crossed bullishly (golden cross), supporting near-term buyers. The price is holding above the mid-Bollinger Band, confirming short-term bullish bias. MACD histogram is rising with increasing volume, indicating strong momentum for continuation in the coming trading sessions. A recent bullish engulfing candlestick signals probable extension of the upward move.
Technical Trend: AUDUSD is currently in a decisively bullish uptrend.
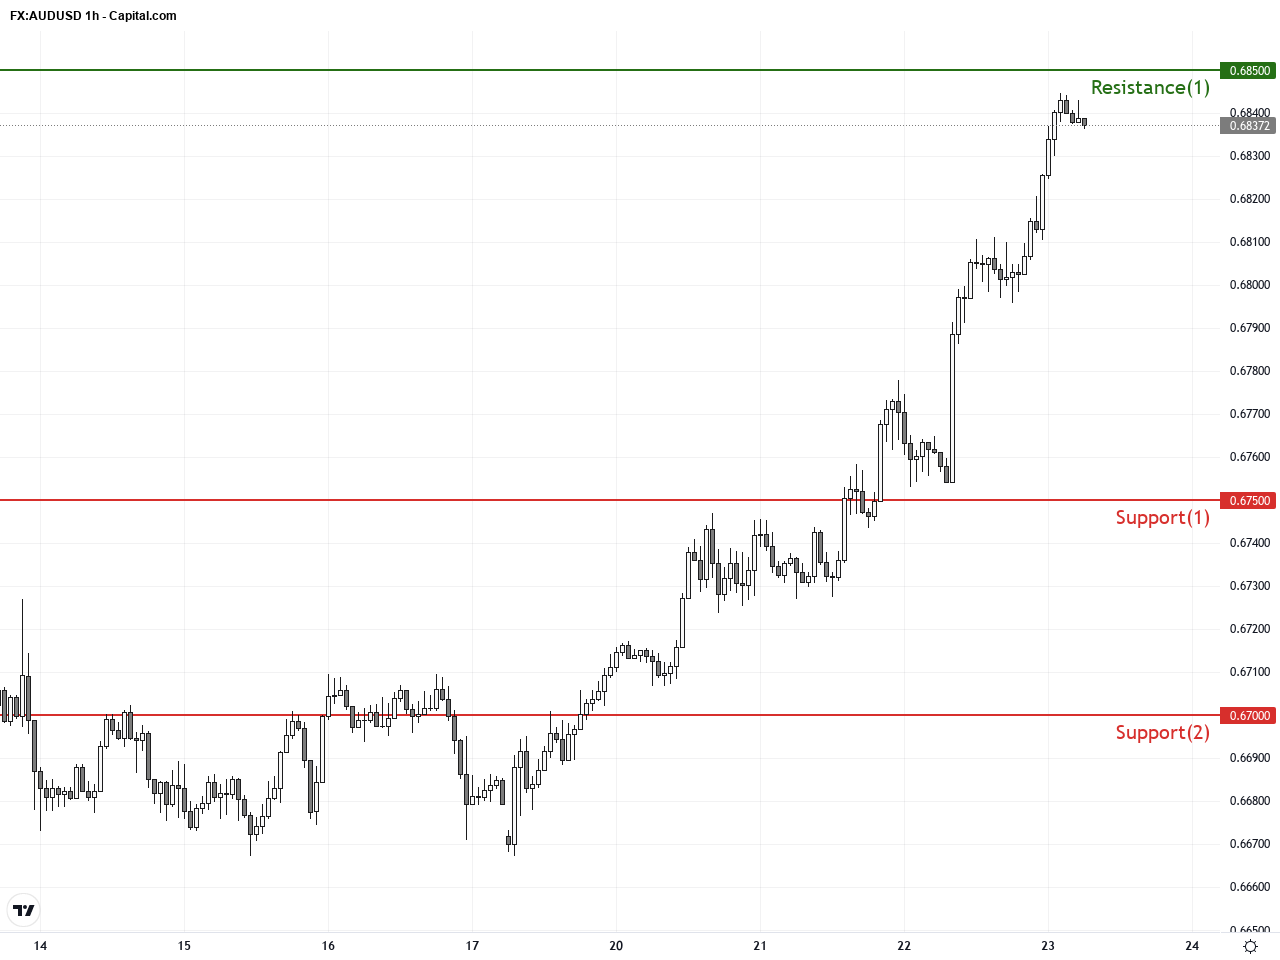
Technically, AUDUSD’s daily chart breakout above 0.6800 marks a critical inflection point for bulls, supported by reinforcing signals from MACD and moving averages. The hourly chart details a bullish engulfing candle combined with a golden cross and Bollinger Band support, highlighting an increased likelihood of sustained upward momentum. Key levels to watch include resistance at 0.6850 and 0.6900—breaking these could unlock further gains. Support lies near 0.6750 and 0.6700, anchoring potential pullbacks and providing favorable entry points.Today’s economic calendar shows the release of Australia’s December unemployment rate and employment change data, which came in better than expected with unemployment dropping to 4.1% and employment increasing by 65,200. This constitutes a strong positive influence for AUDUSD. Japanese trade balance and export reports fell short of forecasts but have limited direct impact on AUDUSD. No other significant economic events today are likely to drastically alter AUDUSD’s bullish trend, supporting a continuation of the current uptrend.
Resistance & Support
The above financial market data, quotes, charts, statistics, exchange rates, news, research, analysis, buy or sell ratings, financial education, and other information are for reference only. Before making any trades based on this information, you should consult independent professional advice to verify pricing data or obtain more detailed market information. 1uptick.com should not be regarded as soliciting any subscriber or visitor to execute any trade. You are solely responsible for all of your own trading decisions.
Latest Technical Analysis
Latest Insightz